
Contraception plays a key role in people’s realization of their sexual and reproductive health and well-being. The factors that shape contraceptive behaviors are complex and dynamic, and there is growing recognition among reproductive health service providers and advocates that contraceptive service delivery must prioritize patients’ values and preferences to help them exercise their reproductive autonomy.1 Similarly, research and public health surveillance systems that measure not only contraceptive use and method selection but also contraceptive preferences are best suited to evaluate service quality and track progress toward meeting the needs of reproductive-aged people.
Building on findings from two previous Guttmacher Institute reports describing Behavioral Risk Factor Surveillance System (BRFSS) data on contraceptive use in 20172 and 2019,3 this report uses data from the 2022 BRFSS to provide an expanded set of state-level estimates of contraceptive use and preferences. In 2022, scientists at Guttmacher collaborated with the Centers for Disease Control and Prevention (CDC) to modify existing questions and include additional questions in the BRFSS family planning module. The resulting data set allows analysis not only of people’s primary contraceptive method use but also of multiple method use, overall contraceptive preferences and method-specific contraceptive preferences.
Data collection for the 2022 BRFSS occurred during a pivotal time for reproductive health and rights due to the US Supreme Court’s June 2022 ruling in Dobbs v. Jackson Women’s Health Organization, which overturned the federal right to abortion. A wave of restrictive state laws and policies have followed, and as legislation concerning sexual and reproductive health care becomes increasingly politicized, state-level policies are key determinants of the quality and accessibility of contraceptive care.4 In this environment, state-level data, especially on person-centered measures of contraceptive preferences, are of paramount importance in understanding how shifts in reproductive health policy and service delivery are felt in the population.
This report finds that contraceptive use is high across all reporting jurisdictions, but there is considerable variation in whether people are realizing preferences for which contraceptives they use or whether to use at all. People who report having used a method that requires some interaction with a provider, for example, are more likely than people using exclusively provider-independent or over-the-counter methods to report their current method as their preferred method of contraception. Throughout this report, we will explore how patterns of contraceptive use and preferences vary by type of method or combination of methods and jurisdiction. Given the elevated barriers to contraception that young people have historically experienced,5,6 we also highlight differences between two age-groups (18–24 and 25–49) where possible.*
Data and Methods
The BRFSS is an annual household health survey conducted by the CDC in collaboration with state health departments. Landline and cell phone interviews with US residents aged 18–49 are used to collect retrospective self-reported data representative of noninstitutionalized adult residents in each jurisdiction where the survey is fielded. Each state’s BRFSS survey has up to three components: a set of core required modules that gather standard demographic and health information, optional multistate modules on specific health topics and state-specific questions added by health departments. For the 2022 BRFSS, surveys were fielded over a period of 13 months from January 2022 to February 2023.
Our analysis draws primarily on data from the optional family planning module of the 2022 BRFSS, which includes questions about contraceptive use, nonuse and preferences (see Appendix for a full list of BRFSS questions used in this analysis). Some 28 jurisdictions (26 US states† and the US territories of Puerto Rico and Guam) administered the family planning module as part of their BRFSS data collection efforts.
Eligibility for the family planning module was limited to respondents who were aged 18–49 at the time of the survey and who were assigned female at birth, were not pregnant and had not had a hysterectomy. Our analysis includes 17,124 eligible individuals across the 28 jurisdictions who reported having had penile-vaginal sex in the 12 months prior to the survey. We considered all of these respondents to be at risk of pregnancy.
Our analysis provides basic tabulations and data visualizations of state-level contraceptive prevalence, methods used at last sex, dual method use and unfulfilled contraceptive preferences. We ran Pearson’s chi-square tests of equal proportions to check for statistically significant differences between groups. A more detailed description of the analytic sample and construction of each indicator is available in the Additional Notes on Data below, and the appendix tables are available as a Microsoft Excel download (see top of page). We conducted all analyses using Stata version 18.0 and used survey weights available in the public data set to adjust all estimates for both complex sampling design and population characteristics. Further information on BRFSS survey methodology, sampling design and data preparation are published elsewhere.7–9 The full BRFSS questionnaire, public data sets, and documentation files for 2022 and prior BRFSS survey years are available on the CDC BRFSS website.10
Highlighted Findings
Current contraceptive use among people at risk of pregnancy
Across all participating jurisdictions in this analysis, the large majority of individuals at risk of pregnancy reported having used contraception at last sex (Table 1). Proportions ranged from 71% (in Guam) to 88% (in Vermont).
- In eight jurisdictions, contraceptive use at last sex was significantly higher among 18–24-year-olds than among 25–49-year-olds. This gap was largest in Connecticut (15 percentage points) and New Jersey (14 percentage points).
- While there were no jurisdictions in which contraceptive use was significantly higher among the older age-group than among the younger age-group, there were 10 jurisdictions in which the difference between the two groups was not statistically significant and 10 in which the sample size of 18–24-year-olds was too small to draw a comparison.
Contraceptive methods used
Respondents who used contraception at last sex were asked to name up to two methods they used. In nearly all states, the most commonly reported methods used were condoms and short-acting hormonal methods, such as birth control pills (Table 2 and Appendix Table 1). On average, across all reporting jurisdictions, one in five people at risk of pregnancy were using either condoms or pills to prevent pregnancy.
- By contrast, IUDs were the method most commonly reported in Vermont and Oregon. About one in four people in Vermont and one in five people in Oregon reported use of this method at last sex, compared with an average of about one in eight people across all participating jurisdictions.
- Puerto Rican respondents most commonly reported using the permanent contraceptive methods of tubal ligation or Essure to prevent pregnancy. Nearly one-third used these methods.
- Permanent methods as a whole (tubal ligation, Essure or vasectomy) were the most common category of methods used in 15 jurisdictions. More than one-quarter of the population at risk of pregnancy in Alabama, Iowa, Nebraska, New Mexico, West Virginia and Wyoming reported using permanent contraception or having a partner who was using a permanent method.‡
Dual method use
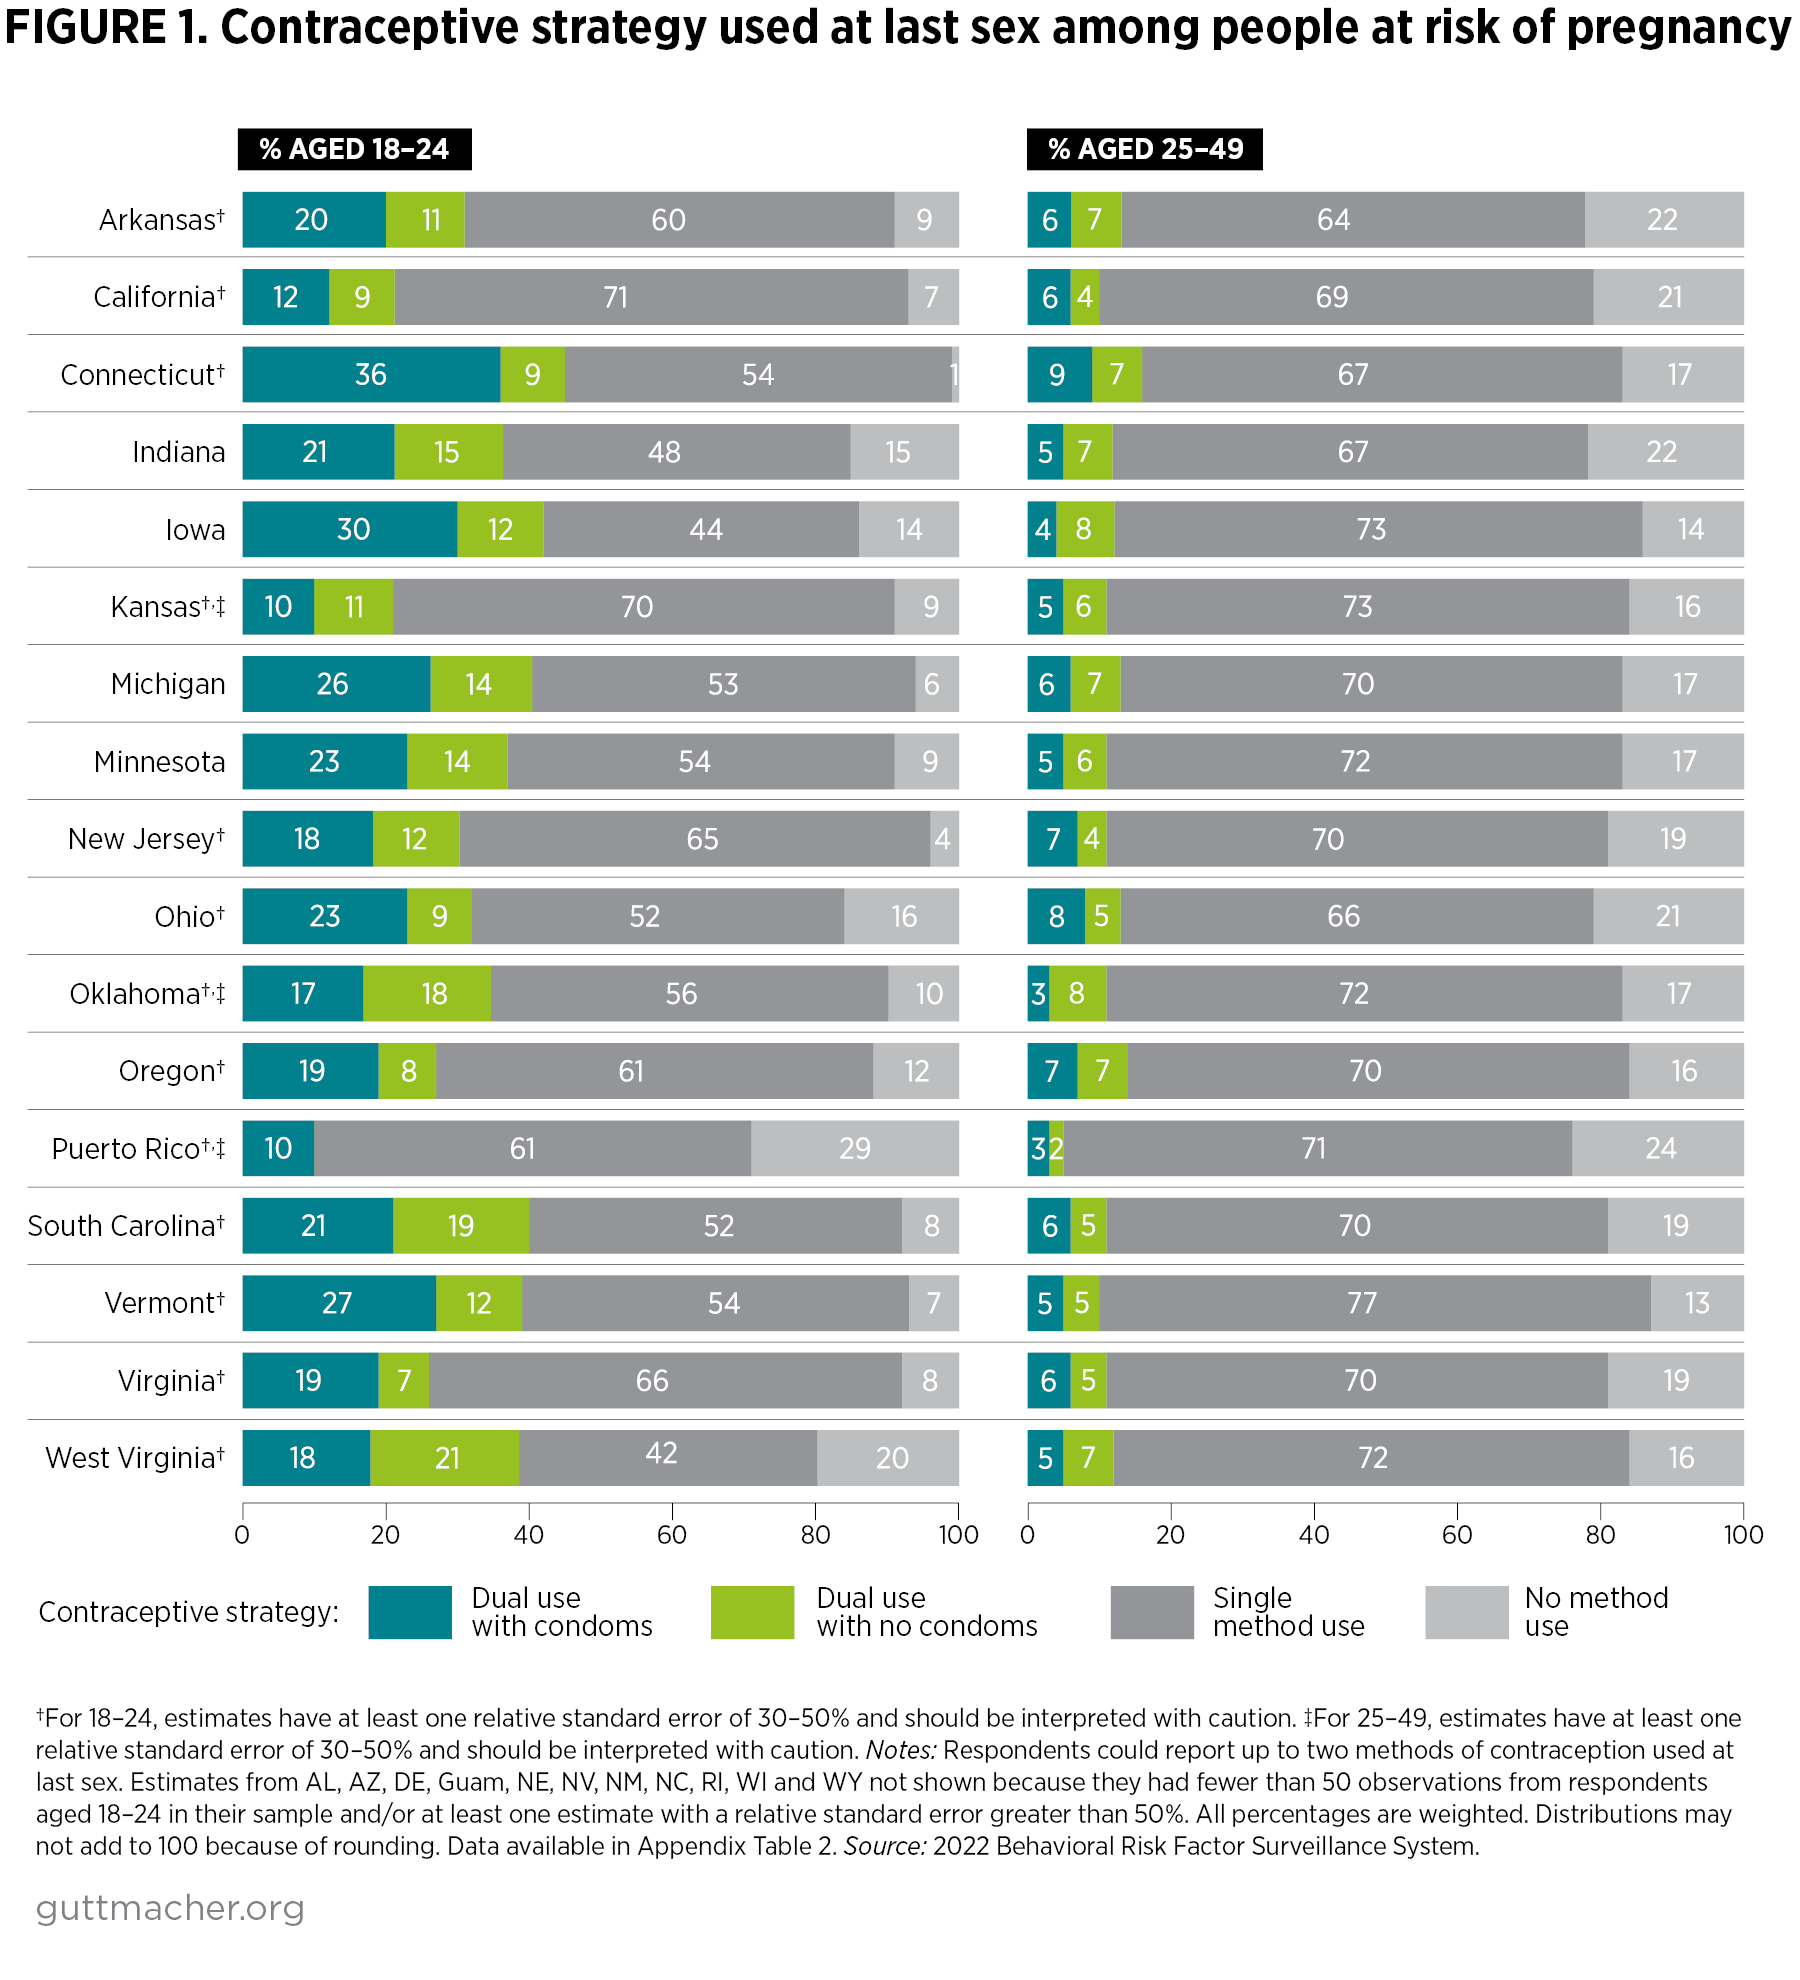
Between 21% and 45% of respondents aged 18–24 reported having used two methods of contraception at last sex across the 17 states in our analysis with sufficient data on this age-group (Figure 1 and Appendix Table 2). Across all 26 states in our analysis, 10–16% of people 25 and older reported using two methods at last sex. Reports of dual method use were considerably lower in Guam and Puerto Rico.
- Dual method users most commonly used condoms in combination with another method. This pattern was especially prevalent among people younger than 25, the majority of whom selected condoms as one of their methods in all but three states.
- People in the younger age-group also employed method combinations that did not include condoms (e.g., combining withdrawal with permanent or hormonal methods) at significantly higher levels than people in the older age-group in eight states.
- In West Virginia, 21% of 18–24-year-olds reported having combined two methods other than condoms, the highest proportion among states with a sample large enough to allow comparison by age-group. Only 7% of 25–49-year-old West Virginians reported the same.
Contraceptive preferences
A substantial proportion (36–71%) of people at risk of undesired pregnancy § in each jurisdiction had unfulfilled contraceptive preferences at last sex, meaning that at the time of the survey, they were using methods other than the methods they reported as preferred, were not using any method when there was a method they preferred or were using a method when they would have preferred not to use any method (Figure 2 and Appendix Table 3).**
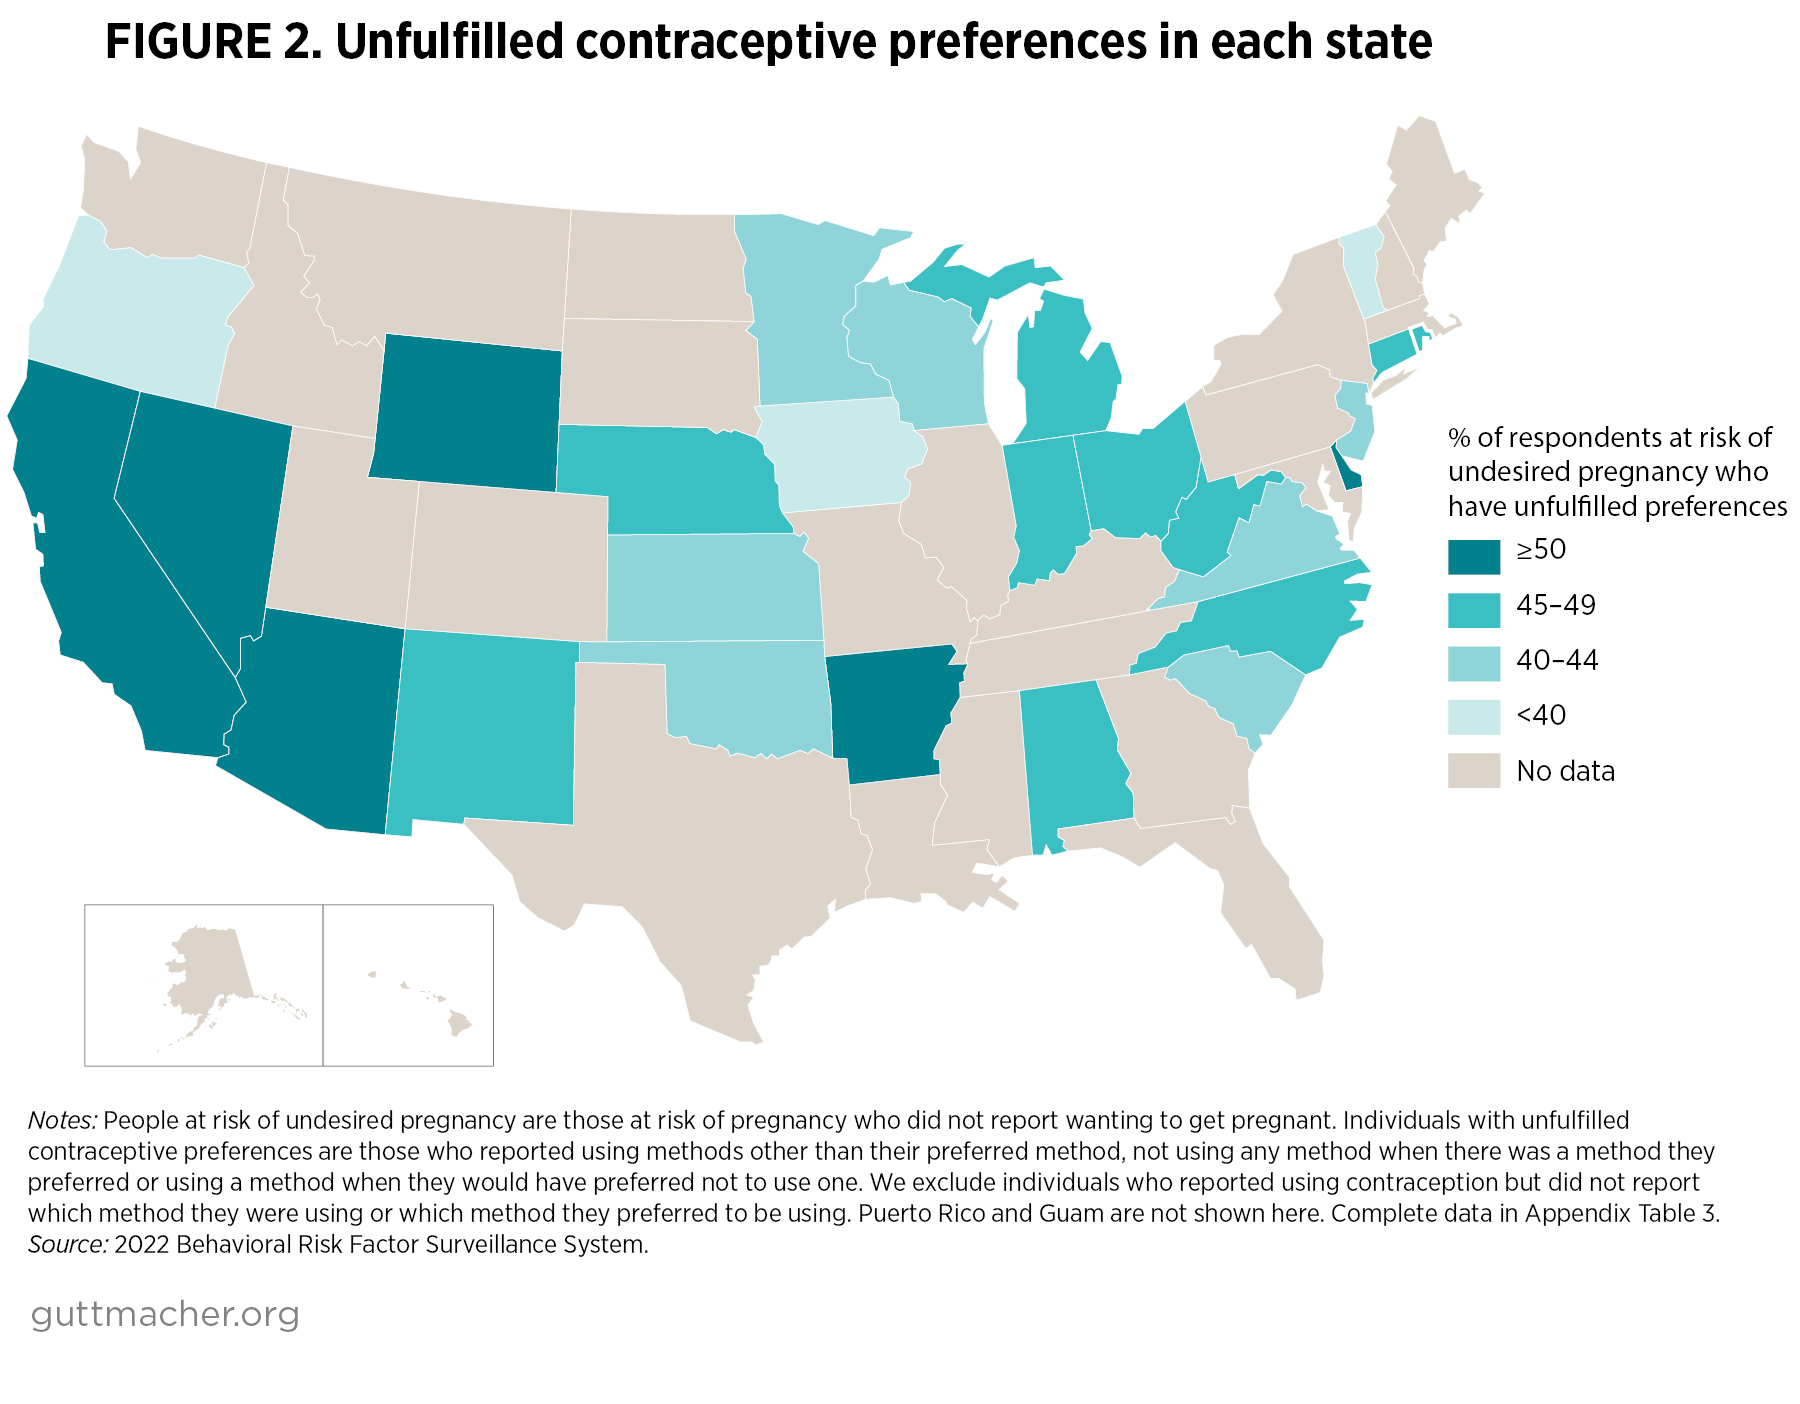
- The state with the highest contraceptive use (Vermont) also had the second-lowest proportion of people at risk of undesired pregnancy with unfulfilled contraceptive preferences (37%).
- However, high levels of contraceptive use did not always translate into high levels of contraceptive preference fulfillment. For example, Wyoming had the second-highest level of overall contraceptive use (87%), and yet about half of people at risk of undesired pregnancy had unfulfilled contraceptive preferences.
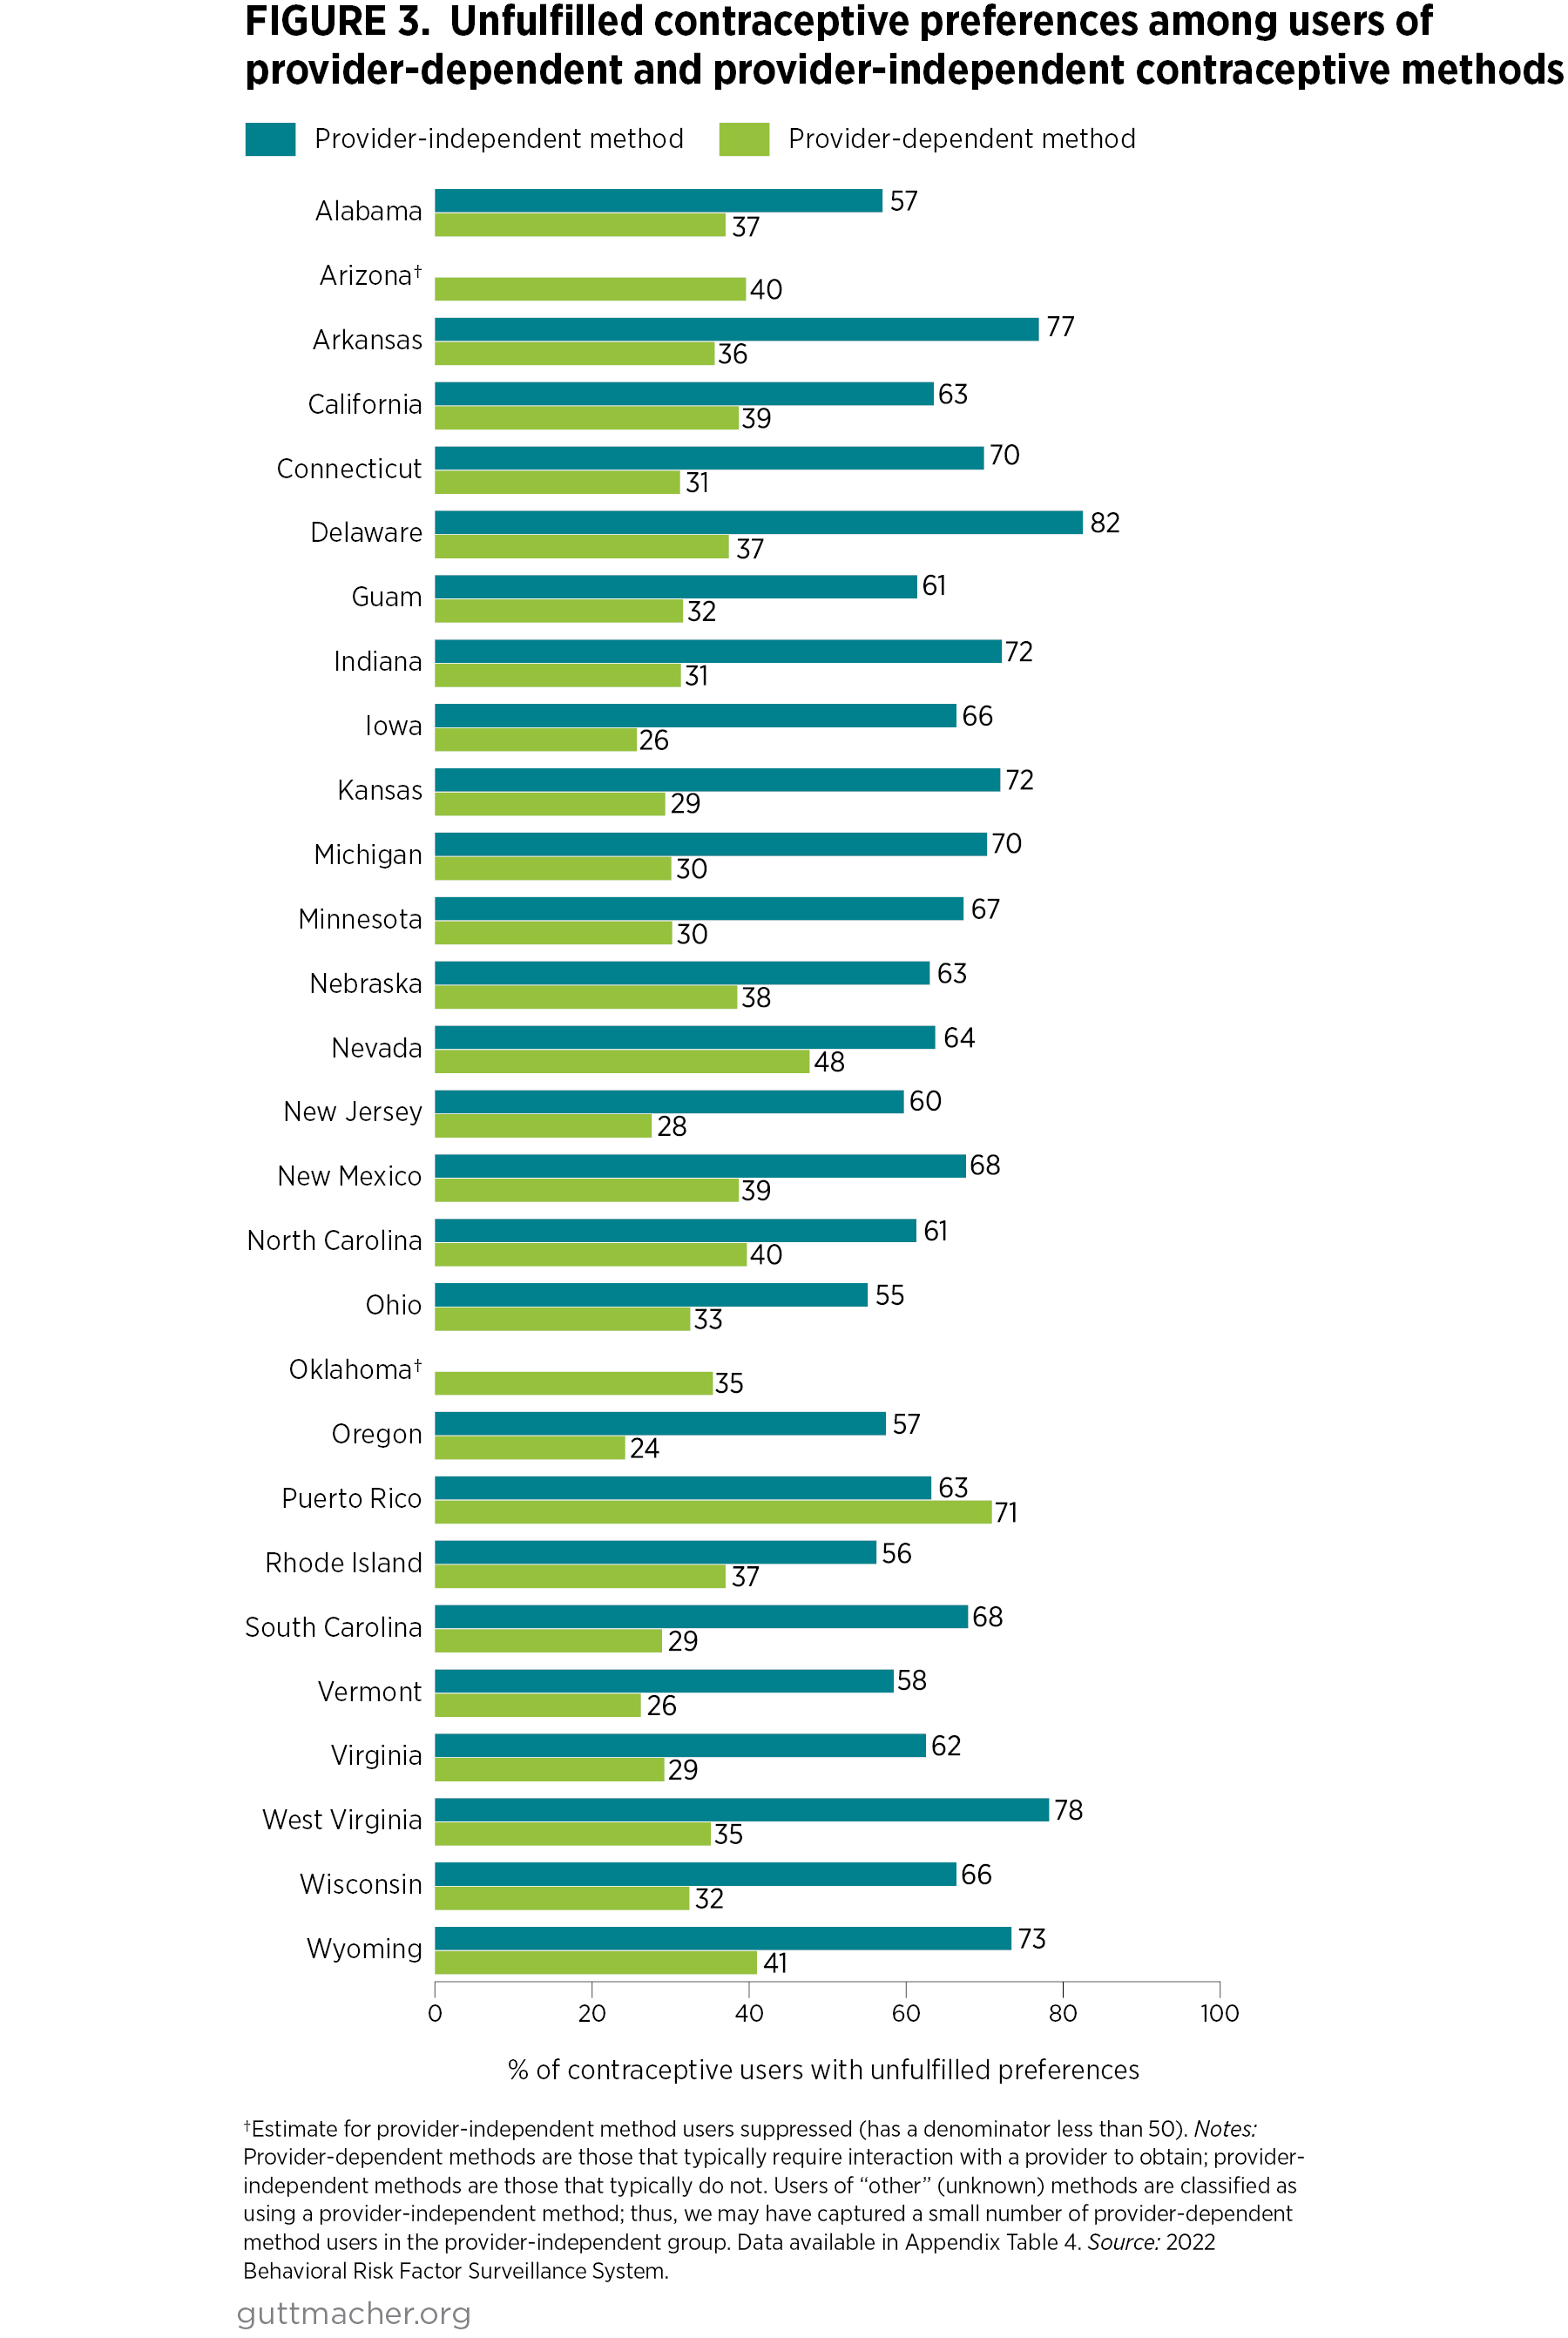
In nearly all jurisdictions, people who exclusively used methods that are typically available over the counter (i.e., provider-independent methods) had significantly higher levels of unfulfilled contraceptive preferences than people who used at least one provider-dependent method at last sex (e.g., sterilization, implants, IUDs and short-acting hormonal methods that typically require either a prescription or a procedure from a provider; Figure 3 and Appendix 4).
- This pattern held true for users in every jurisdiction except Nevada and Puerto Rico, where there were no significant differences by whether methods used were provider-dependent, and Arizona and Oklahoma, where we had insufficient data to draw comparisons by method type.
- Across all jurisdictions for which we have data, the majority (55–78%) of people who used only provider-independent methods at last sex reported that they would have preferred to have used a different method.
Discussion
These latest BRFSS data on state-level contraceptive use and preferences reflect the ongoing reality that as in 2017 and 2019, the majority of people at risk of pregnancy are using some form of contraception—and in most jurisdictions with data, they are most commonly using condoms or pills. However, compared with past surveys, the 2022 BRFSS data provide a more comprehensive and nuanced understanding of use and preferences by highlighting simultaneous use of two contraceptive methods. Data on dual method use at last sex shed light on the reality that contraceptive behavior is complex and is not well-captured by measuring only the most effective method used, which is common in state-level contraceptive tracking efforts.11,12 In 2022, although use of a single method of contraception was the most common strategy employed by users, combining condoms with another method or combining two non-condom methods were additional strategies that varied across states and have not previously been documented at the state level.
We find that compared with respondents aged 25–49, people in the younger age-group reported higher overall contraceptive use, higher use of two contraceptive methods at last sex and higher use of condoms as part of their dual use across most jurisdictions. One factor may be that the youngest adults—who are less likely than older adults to be married or cohabiting13 and more likely to have had more than one recent sexual partner14—maybe be more motivated to prevent STIs, and thus to use condoms in combination with another method. However, we also see more dual method use among 18–24-year-olds that does not involve condoms, suggesting that multiple factors shape dual method use in this population.11 Notably, pregnancy prevention may be especially salient within this younger age-group, particularly as other options for ensuring their reproductive autonomy, such as access to abortion, are increasingly threatened.
Perhaps the most actionable findings in this report are those on unfulfilled contraceptive preferences at the state level, a metric that sheds light on the extent to which there are gaps between methods used and methods desired. Furthermore, higher unfulfilled preferences among people using exclusively over-the-counter methods suggest that many people may face substantial barriers, including barriers to getting provider-based care, that make it harder for them to obtain their preferred methods and satisfy their contraceptive needs. Jurisdictions where high levels of unfulfilled contraceptive preferences are reported among people at risk of undesired pregnancy—such as Arizona, Arkansas, California, Delaware, Guam, Nevada, Puerto Rico and Wyoming—can bring contraceptive use and preferences into greater alignment by supporting policies and programs that ensure equitable access to health-related resources.
The 2022 BRFSS family planning module’s more nuanced and comprehensive measures of contraceptive use and preferences provide critical data at a pivotal time for sexual and reproductive health and rights in the United States. The Dobbs decision was followed by an increase in restrictive state-level policies and widespread confusion around availability of sexual and reproductive health care services that has had implications far beyond access to abortion.4 Without national protections for reproductive health and rights, we see far more variability in access to essential sexual and reproductive health care at the state level: Supportive states are generally moving to protect or expand access to contraception and abortion, while other states have taken the opportunity to further restrict such access.4 In this environment, state-level data, especially on person-centered measures of contraceptive preferences, are of paramount importance in understanding how shifts in reproductive health policy and service delivery are felt in the population. Other state-level surveillance efforts that monitor contraceptive use, such as the Pregnancy Risk Assessment Monitoring System (PRAMS)15,16 and the Surveys of Women,17 help to round out what is known about this crucial aspect of reproductive autonomy. Going forward, we recommend greater synergy across these state-level efforts in how contraceptive use and preferences are assessed. Increased collaboration will help support the production of high-quality scientific evidence that sheds light on the extent to which changes in federal and state policies and programs may facilitate or impede individuals’ ability to fulfill their right to reproductive autonomy.
Additional Notes on Data
Data collection period. Data collection for this survey took place from January 2022 to February 2023. Within that time frame, the Dobbs v. Jackson Women’s Health Supreme Court ruling significantly changed the landscape of sexual and reproductive health care in the United States. We do not distinguish between the pre- and post-Dobbs time periods in this analysis but acknowledge that this event may have had an impact on people’s contraceptive use and preferences.
Definition of population at risk. Throughout the report, we define people as at risk of pregnancy as those who were aged 18–49 at the time of the interview, were assigned female at birth, were not pregnant, had no history of hysterectomy and had had penile-vaginal sex in the previous 12 months. In Figure 2 and Appendix Table 3, we further restricted our analysis of contraceptive preference fulfillment among both contraceptive users and nonusers to people at risk of undesired pregnancy. We define people as being at risk of undesired pregnancy if they met all the criteria for “at risk of pregnancy” and did not report wanting to get pregnant as the primary reason for not using contraception at last sex.
Analytic sample selection. We included all people who completed the 2022 BRFSS questionnaire and family planning module in the 26 states and two territories that fielded the optional module. Of the 34,299 respondents aged 18–49 who were assigned female at birth and did not report a current pregnancy or previous hysterectomy, 11,041 dropped out of the survey prior to reaching the family planning module. For the question “In the past 12 months, did you have sexual intercourse?” 894 survey respondents did not answer, 4,844 responded “no” and 68 responded “don’t know/not sure;” these respondents were not directed to continue to the subsequent questions in the module.
Among those who replied “yes” to having had penile-vaginal sexual intercourse in the past 12 months, we excluded 69 who were missing information on current pregnancy status, 38 who were missing information on whether they had had a hysterectomy, and 205 did not know or were missing responses to the question: “The last time you had sexual intercourse, did you or your partner do anything to keep you from getting pregnant?” Lastly, we dropped 19 respondents who, in the sexual and gender identity module, reported being trans women (i.e., females assigned male at birth) and two respondents who reported being assigned male at birth as the reason for not using contraception at last sex. After all exclusions, our final analytic sample included 17,124 people at risk of pregnancy with complete information on eligibility criteria, sexual activity and contraceptive use.
Variable construction. In our analysis, we constructed or recoded several variables using data from the BRFSS family planning module.
- Overall contraceptive use (Table 1). We coded any respondent who reported using contraception at last sex as a user, regardless of whether they provided a response regarding the type of method they were currently using. In addition, for Table 1, we recoded as a user any respondent who answered “no” to the question about whether they used anything to prevent pregnancy at last sex but subsequently reported using withdrawal, having had a tubal ligation or having a partner who has had a vasectomy as their reason for not doing anything to keep from getting pregnant. We then recoded these users to the appropriate method in Table 2.
- Method type (Table 2 and Appendix Table 1). Respondents were asked an open-ended question regarding the type of method they or their partner used the last time they had sexual intercourse to keep from getting pregnant. In a follow-up question, they were asked if they used any other method at last sex. In Table 2, we provide the percentage of people at risk of pregnancy who reported using each method at any point in the family planning module. The “other methods” category includes respondents who reported having used contraceptives and when asked what method was used either selected “other” or “don’t know/not sure,” did not report a specific method, or reported one or both of the two method categories that we combined with “other” because of small cell size (diaphragms/cervical caps/spermicide and emergency contraception).
- Dual method use (Figure 1 and Appendix Table 2). Because respondents were given the opportunity to report up to two concurrent methods used at last sex, we constructed a variable to represent four mutually exclusive contraceptive strategies: 1) no method use, 2) single method use, 3) dual method use combining any method with condoms and 4) dual method use combining two methods other than condoms. Any users who did not report a specific method used at last sex and were coded as “other” method users were assumed to have used only one method.
Contraceptive preferences (Figures 2 and 3 and Appendix Tables 3 and 4). We constructed a binary variable of unfulfilled contraceptive preferences in which we marked respondents as having unfulfilled preferences if they reported that the last time they had sex they 1) used a method other than their preferred method, 2) used a method but reported that they preferred not to be using one or 3) did not report using contraception but cited a preferred method when asked. Conversely, we considered respondents to have fulfilled their contraceptive preferences if they had either used their preferred method or had not used any method and reported not wanting to be using a method. Anyone who reported not using contraception because they wanted to get pregnant was excluded from measurements of contraceptive preferences.
In Figure 2, we report the percentage of all people who were at risk of undesired pregnancy with unfulfilled contraceptive preferences in each jurisdiction, excluding Puerto Rico and Guam. We defined someone as at risk of undesired pregnancy if they met all criteria for being at risk of pregnancy and did not report that they wanted to get pregnant. Appendix Table 3 provides the proportions of these same people with either fulfilled or unfulfilled preferences, separately by age-group and combined for all 28 jurisdictions. We used Pearson’s chi-square tests to compare differences between the proportion of each age-group with unfulfilled preferences in each state and found no significant differences in any jurisdiction in which the data met our reliability standards; thus, we do not display the results of these tests.
In Figure 3, we report unfulfilled contraceptive preferences only among people who used any method of contraception at last sex, by whether the type of method used typically requires an interaction with a provider. Appendix Table 4 provides the proportion of these same users with either fulfilled or unfulfilled contraceptive preferences, as well as the results of Pearson’s chi-square tests of differences between the proportion of each group with unfulfilled preferences.
Gender identity. We used respondent sex at birth to determine eligibility for the family planning module and thus our analytic sample. We used the CDC-constructed variable “_sex” to determine sex at birth, which is coded based on responses to demographic questions in the core module or, if possible, the optional sex at birth module, which was fielded in eight of the 28 jurisdictions that fielded the family planning module. Gender identity was collected in 18 of the 28 jurisdictions that fielded both the family planning module and the sexual and gender identity (SOGI) module. We dropped any respondents in the overlapping jurisdictions who were trans women (i.e., selected “yes, transgender, male-to-female”). Around 1% of respondents who reported their sex as female in the core module reported being either trans men or trans/nonbinary (i.e., selected “transgender, female-to-male” or “gender nonconforming”) in the SOGI module. We assumed these individuals were at risk of pregnancy and thus included them in our sample.
Reliability standards. For any estimate based on the full analytic sample, we used the reliability standards established by the CDC,18 suppressing any estimates where the relative standard error exceeded 30%. For age-disaggregated results, we display estimates with a relative standard error up to 50% but flag any results with a relative standard error of 30–50% to urge caution when interpreting the findings. We suppress all estimates with an unweighted denominator of fewer than 50 observations from the report, regardless of aggregation.
We calculated relative standard error by dividing the standard error by the point estimate and multiplying by 100. In Table 2 and Appendix Table 1, we combined some methods that did not meet reliability standards in any or nearly any states with other categories. Specifically, we folded injectable contraceptives into a single category for short-acting hormonal methods, along with pills, vaginal rings and contraceptive patches. We grouped diaphragms, cervical caps, sponges, various forms of spermicide and emergency contraception under “other” methods for the same reason.
Limitations
- BRFSS response rates are low in many states. The median combined (landline and cell phone) response rate for the 2022 BRFSS samples in our 28 jurisdictions was 44%, with rates ranging from 23% in Guam to 59% in Puerto Rico. Of the 26 continental states in our analysis, response rates ranged from 36% in California to 55% in Iowa.19
- Some 24 states did not field the family planning module in the 2022 BRFSS, and this prevented us from providing a comprehensive picture of US contraceptive use and preferences or drawing regional comparisons. The number of states abstaining from collecting these data nearly doubled since 2019, indicating that states may be increasingly reluctant to accept or participate in research related to sexual and reproductive health at a time when this research is particularly vital.
- The BRFSS explicitly measures use of and preferences for contraceptives only for the purposes of pregnancy prevention at last sex among people who have had penile-vaginal sex within the past 12 months. This definition of contraceptive use may exclude people using methods for reasons other than pregnancy prevention. In addition, these measures do not gather information on the contraceptive use or preferences of people whose most recent sexual activity was more than one year prior or who engaged exclusively in other forms of sexual activity in the preceding year. To obtain estimates that capture the full extent of contraceptive use and preferences in the population, future efforts should take into account that people may use contraception for reasons other than pregnancy prevention, as well as at intervals and in ways not currently captured by the survey.
- Although the 2022 version of the family planning module improved measurement of contraceptive use and preferences, the changes to the questionnaire prevent us from analyzing trends in contraceptive use across time. In 2019, no time frame was provided when asking respondents about contraceptive use at last sex. In 2022, the survey first asked respondents to report whether they had had penile-vaginal intercourse within the past 12 months and conducted the remainder of the family planning module only with respondents who answered “yes” to this initial question. Thus, we see differences in contraceptive use between rounds that may be attributable to changes in measurement rather than, or in addition to, changes in behavior.
Appendix
Appendix TablesBRFSS survey questions relevant to this analysis