Key Points
- In almost all U.S. states, pregnancies reported as occurring at the right time or being wanted sooner than they occurred comprised the largest share of pregnancies in 2017, though proportions varied widely by state.
- The proportion of pregnancies that were wanted later or unwanted was higher in the South and Northeast than in other regions, and the proportion of pregnancies that occurred at the right time or were wanted sooner was higher in the West and Midwest.
- From 2012 to 2017, the wanted-later-or-unwanted pregnancy rate fell in the majority of states. However, no clear pattern emerged for any changes in the rate of pregnancies that were reported as wanted then or sooner or in the rate of those for which individuals expressed uncertainty.
Introduction
This report provides state-specific estimates of the numbers and rates of pregnancy according to women’s self-reported pregnancy desire. These estimates represent pregnancies in 2017, and trends from 2012 to 2017, among women aged 15–44* residing in each U.S. state. The report also presents percentage distributions of births by categories of reported pregnancy desire among women aged 15–44 in those states and jurisdictions for which we have comparable data.
Pregnancy desire is a measure of how individuals felt about becoming pregnant at the time their pregnancy occurred. We provide estimates for three pregnancy desire categories:
- pregnancies wanted at the time that they occurred or sooner than they occurred
- pregnancies wanted later than the time that they occurred or not wanted at all
- pregnancies characterized by uncertainty, defined as those occurring among individuals who reported that prior to their pregnancy they had not been sure whether they wanted to become pregnant
Our measures of pregnancy desire come from two sources. For pregnancies ending in live birth, we use data from the annual Pregnancy Risk Assessment Monitoring System (PRAMS) surveys, a surveillance project conducted by the Centers for Disease Control and Prevention (CDC). Data on pregnancy desires relating to pregnancies ending in abortion come from the Guttmacher Institute’s 2014 Abortion Patient Survey. We combine data on pregnancy desires from these surveys with annual counts of births and abortions in a Bayesian model. This approach allows us to inform our estimation of numbers, proportions and rates of pregnancy for each state and year—including for states without PRAMS data on pregnancy desires for specific years or at all—using all available data. It also enables us to quantify the precision of each estimate, expressed as uncertainty intervals (Box 1).
Box 1. How to interpret uncertainty intervals in this report
Varying amounts of data inform each estimate, and as a result, estimates for some states and years are more precise than others. The 95% uncertainty intervals presented alongside each estimated number, proportion or rate can be interpreted as the range of values plausible for that state and year, based on the information used in our model. For example, a rate with a very wide uncertainty interval has a wide range of other plausible rates compatible with our model, and this range should be considered in any interpretation of the estimate. Readers should pay particular attention to these intervals when making comparisons between states or over time. A complete description of the methodology used to calculate the estimates and the uncertainty intervals, including estimation of pregnancy desires for pregnancies ending in fetal loss, is available in the Methodology Appendix (PDF download).
Estimates presented in this report are not comparable with those based on PRAMS data prior to 2012 because of a change in the wording of the question on pregnancy desires beginning with the 2012 PRAMS surveys.1 In addition, our state-level estimates are not comparable with national-level estimates based on other data sources.2 Not only do the questions used to elicit pregnancy desires differ between the state-level and national-level surveys but the answer options presented to respondents do as well.
Pregnancy Desires Versus Pregnancy Intentions
Researchers, and some prior published Guttmacher reports with similar state-level estimates, typically refer to the "intention status" of pregnancies. They use the term "intended" to refer to pregnancies that people describe as having wanted at the time the pregnancy occurred or having wanted sooner than it occurred.
However, the question used to assign pregnancy intention status in the PRAMS surveys does not ask respondents to report on whether they had intended to become pregnant; it asks them to report whether they wanted to become pregnant. Specifically, respondents are asked, "Thinking back to just before you got pregnant with your new baby, how did you feel about becoming pregnant?" Response categories are: "I wanted to be pregnant sooner," "I wanted to be pregnant later," "I wanted to be pregnant then," "I didn’t want to be pregnant then or at any time in the future" and "I wasn’t sure what I wanted." Some of the respondents who report that they wanted to be pregnant at the time the pregnancy occurred may have intended to become pregnant; others may not have intended or planned the pregnancy, even if they say that it occurred at the right time.
The term "unintended" is likewise imperfect. It generally is used to denote pregnancies that people describe as having wanted later than when the pregnancy occurred (typically referred to as "mistimed" pregnancies) or as not having wanted at all. However, a mistimed pregnancy may be one that an individual had intended or planned on having later; alternatively, it may be one that the individual simply felt did not happen at the right time. In addition, only those pregnancies that were mistimed in one direction are conventionally included in this category: those that were wanted later, not those wanted sooner.
For these reasons, instead of using the traditional "intention status" nomenclature, we refer to pregnancy desire groups using the response options individuals selected from those presented in the surveys. Whether the available response options are sufficient to accurately characterize pregnancy and childbearing attitudes is still an open question and deserving of further research.
Pregnancy Desire Categories
Our analysis provides estimates for pregnancies in three broad categories of pregnancy desire: pregnancy wanted then or sooner, pregnancy wanted later or unwanted, and pregnancy about which an individual wasn’t sure. We combine response categories for several reasons.
Ideally, for each state, we would want to be able to examine pregnancies across all five desire categories, because each category captures different characterizations of pregnancy desire, particularly regarding preferences for the timing of the pregnancy. We can do so for pregnancies ending in births because the distribution of pregnancy desires for births is available from the PRAMS data, but no state-level, representative data on pregnancy desires among individuals having abortions currently exist for all, or even a majority, of states.
The nationally representative 2014 Abortion Patient Survey includes a question on pregnancy desires that approximately mirrors the PRAMS question. From these data, we know that the vast majority of abortions in the United States (about 95%) involve pregnancies that individuals wanted either later or not at all; very small proportions of abortions involve pregnancies wanted then or sooner (about 3%) or pregnancies that individuals were unsure about (approximately 1%). Because of the size of the latter two groups, any variation between states or over the six-year period presented here is unlikely to affect overall estimates. Consequently, we use national proportions to estimate pregnancy desires for pregnancies ending in abortion at the state level for each year from 2012 to 2017, with some additional uncertainty incorporated into our model to account for small variations between states or over time (download the Methodology Appendix for details on methodology and data sources used to calculate estimates).
However, among pregnancies ending in abortion that were wanted later or not at all—the majority of all abortions—the proportion of pregnancies that were wanted later as compared with the proportion not wanted at all could potentially vary widely between states, so it is inappropriate to use national proportions for these two groups separately. For this reason, the pregnancy statistics presented in this report combine pregnancies that were wanted later and those that were not wanted at all to form one group of pregnancies that were not desired when they occurred; we combine the wanted-then and wanted-sooner categories for similar reasons.
Finally, the answer option "I wasn’t sure what I wanted" is treated as a distinct category that more closely aligns with feelings of uncertainty or ambivalence prior to pregnancy.
Findings
Pregnancy desires related to pregnancies occurring in 2017
For 2017, we estimated the numbers and proportions of pregnancies that were categorized as wanted then or sooner, wanted later or unwanted, or occurring among individuals who reported that they had been unsure of their pregnancy desire before becoming pregnant, as well as the associated 95% uncertainty intervals, for residents of each state. Pregnancies were calculated as the sum of births, abortions and fetal losses. Appendix Table 1 (PDF download) presents these estimates in full; below, we highlight the range of estimates across the states in the proportion of pregnancies in each desire category and describe notable regional patterns.
Pregnancies wanted then or sooner
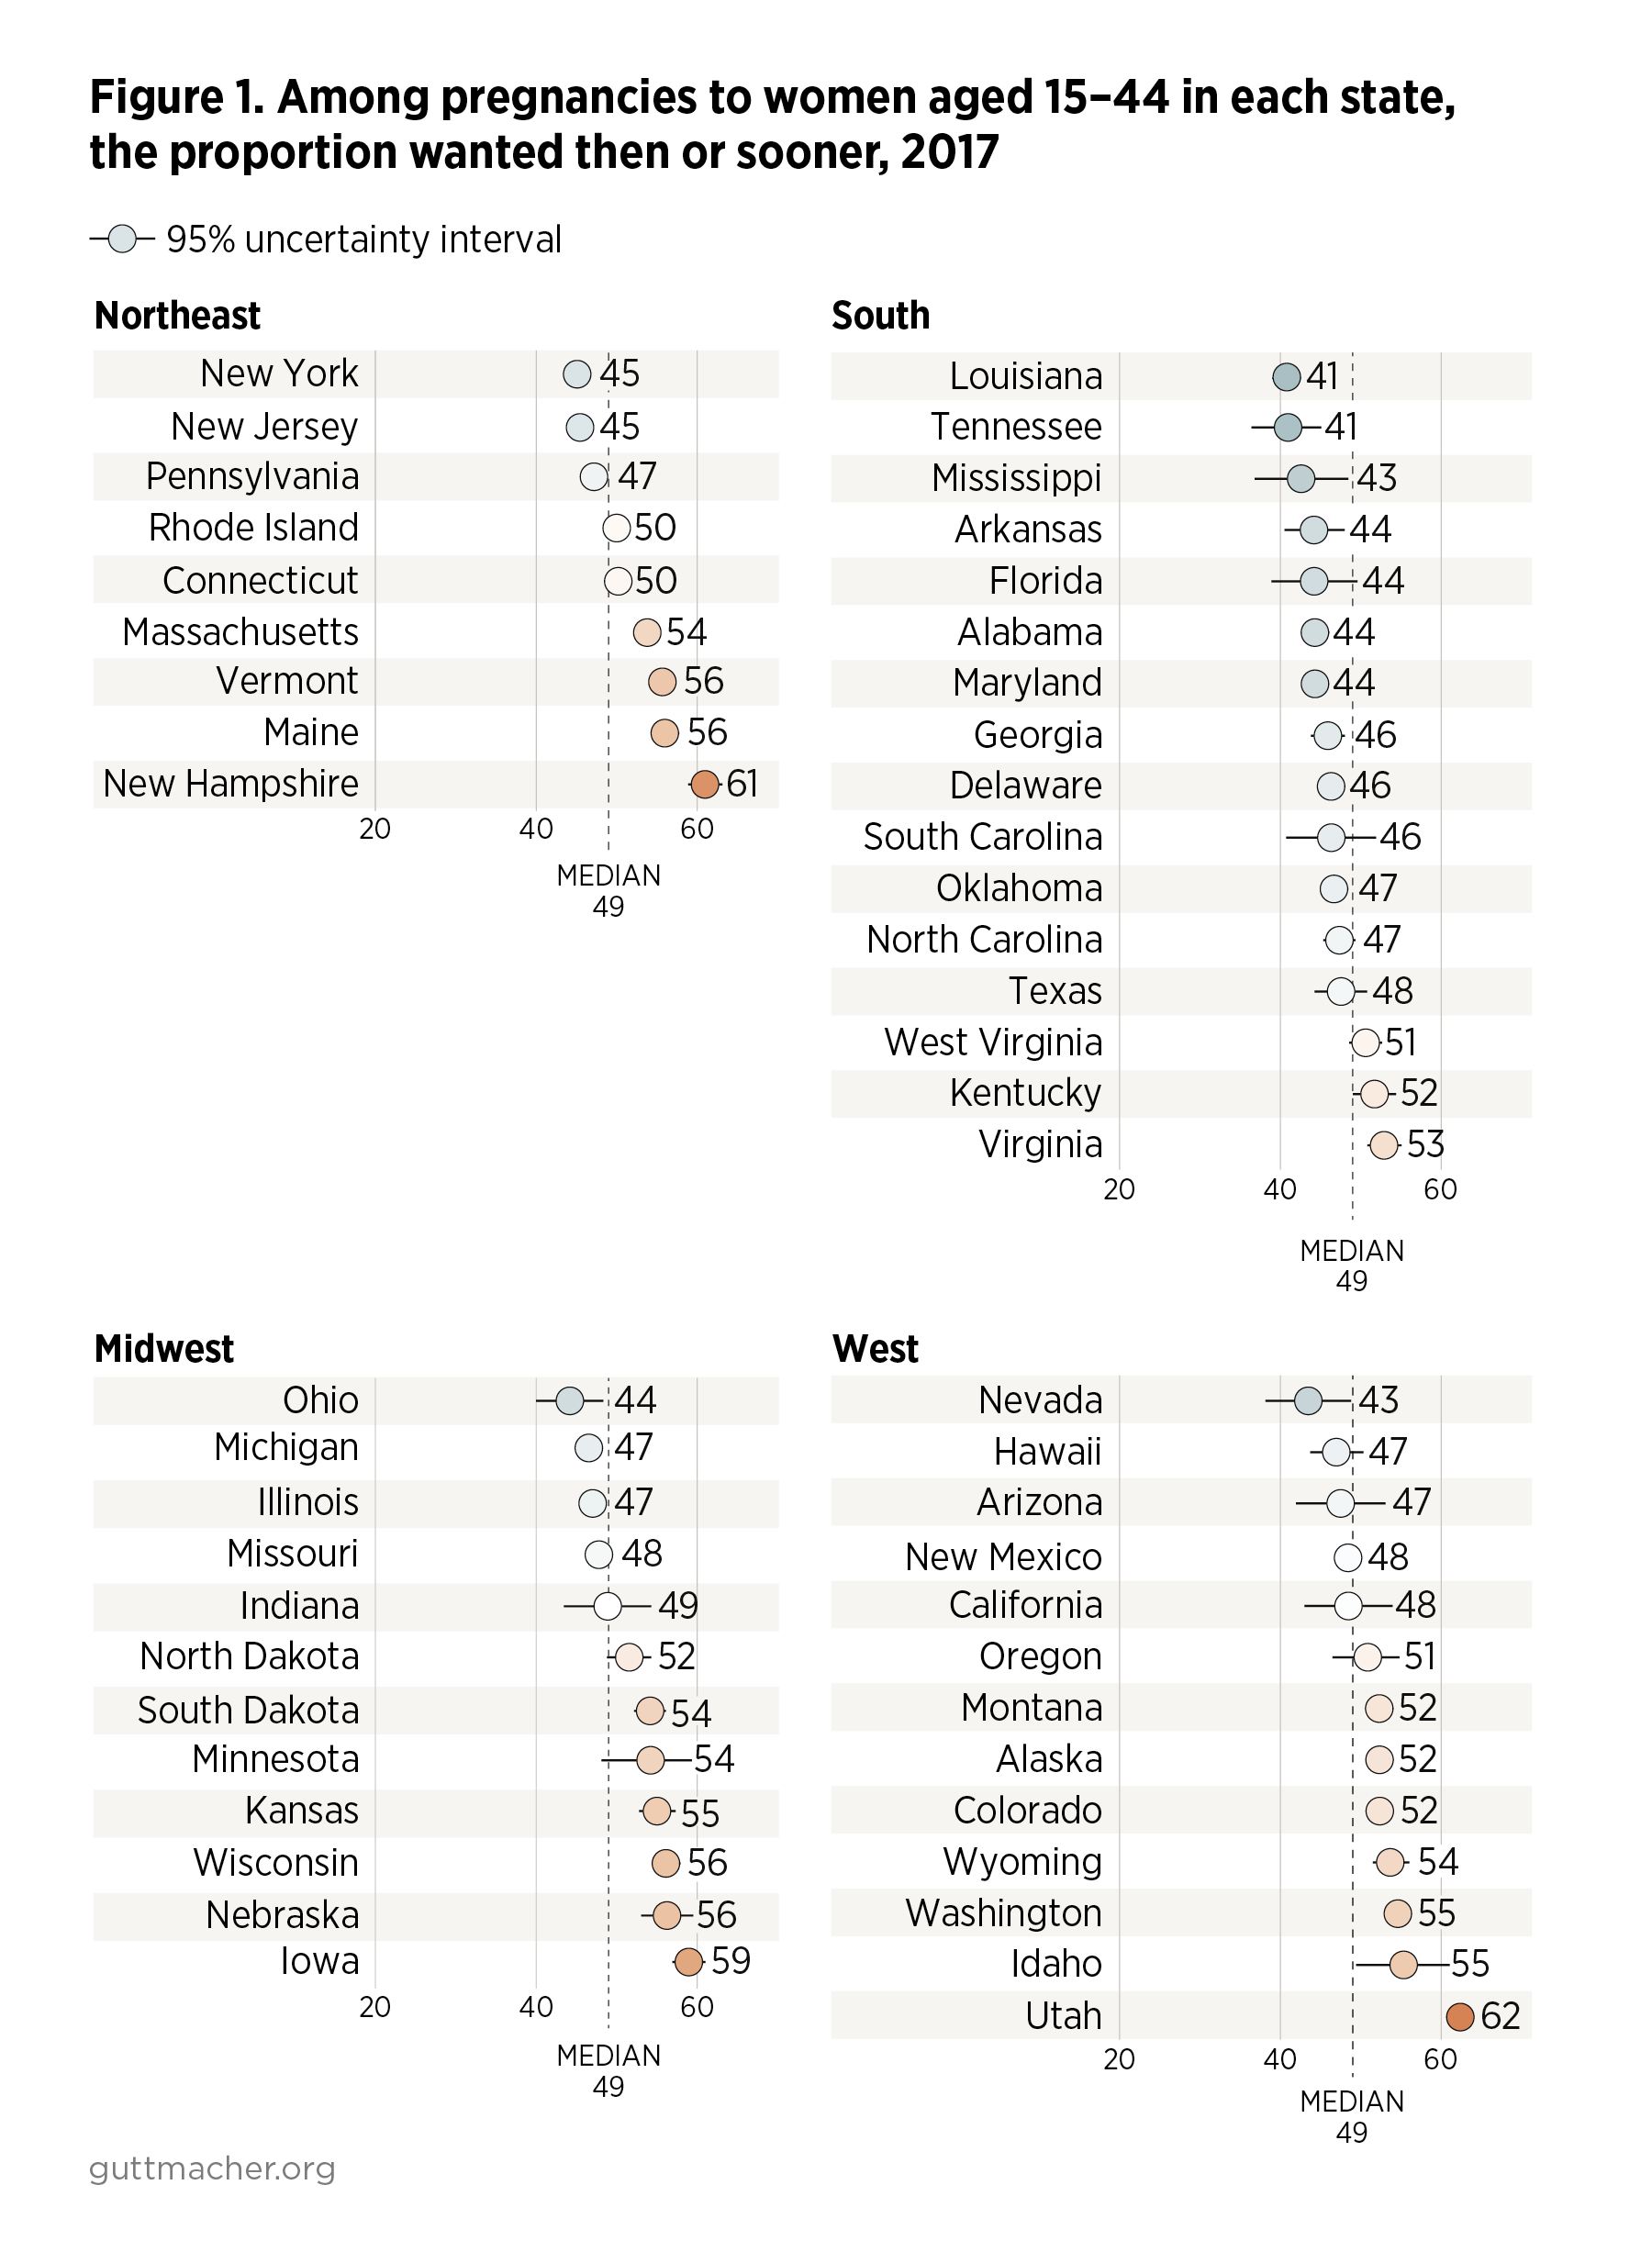
Estimates of the proportion of pregnancies that were wanted then or sooner ranged from 41% (with a 95% uncertainty interval of 39–43%) in Louisiana and Tennessee (36–45%) to 62% (61–64%) in Utah. There was relatively wide variation across states in the proportion of pregnancies that were categorized as wanted at the time or sooner than they occurred (Figure 1). The highest proportions were evident in the West, in the Midwest and in several states in the Northeast.
Pregnancies wanted later or not wanted
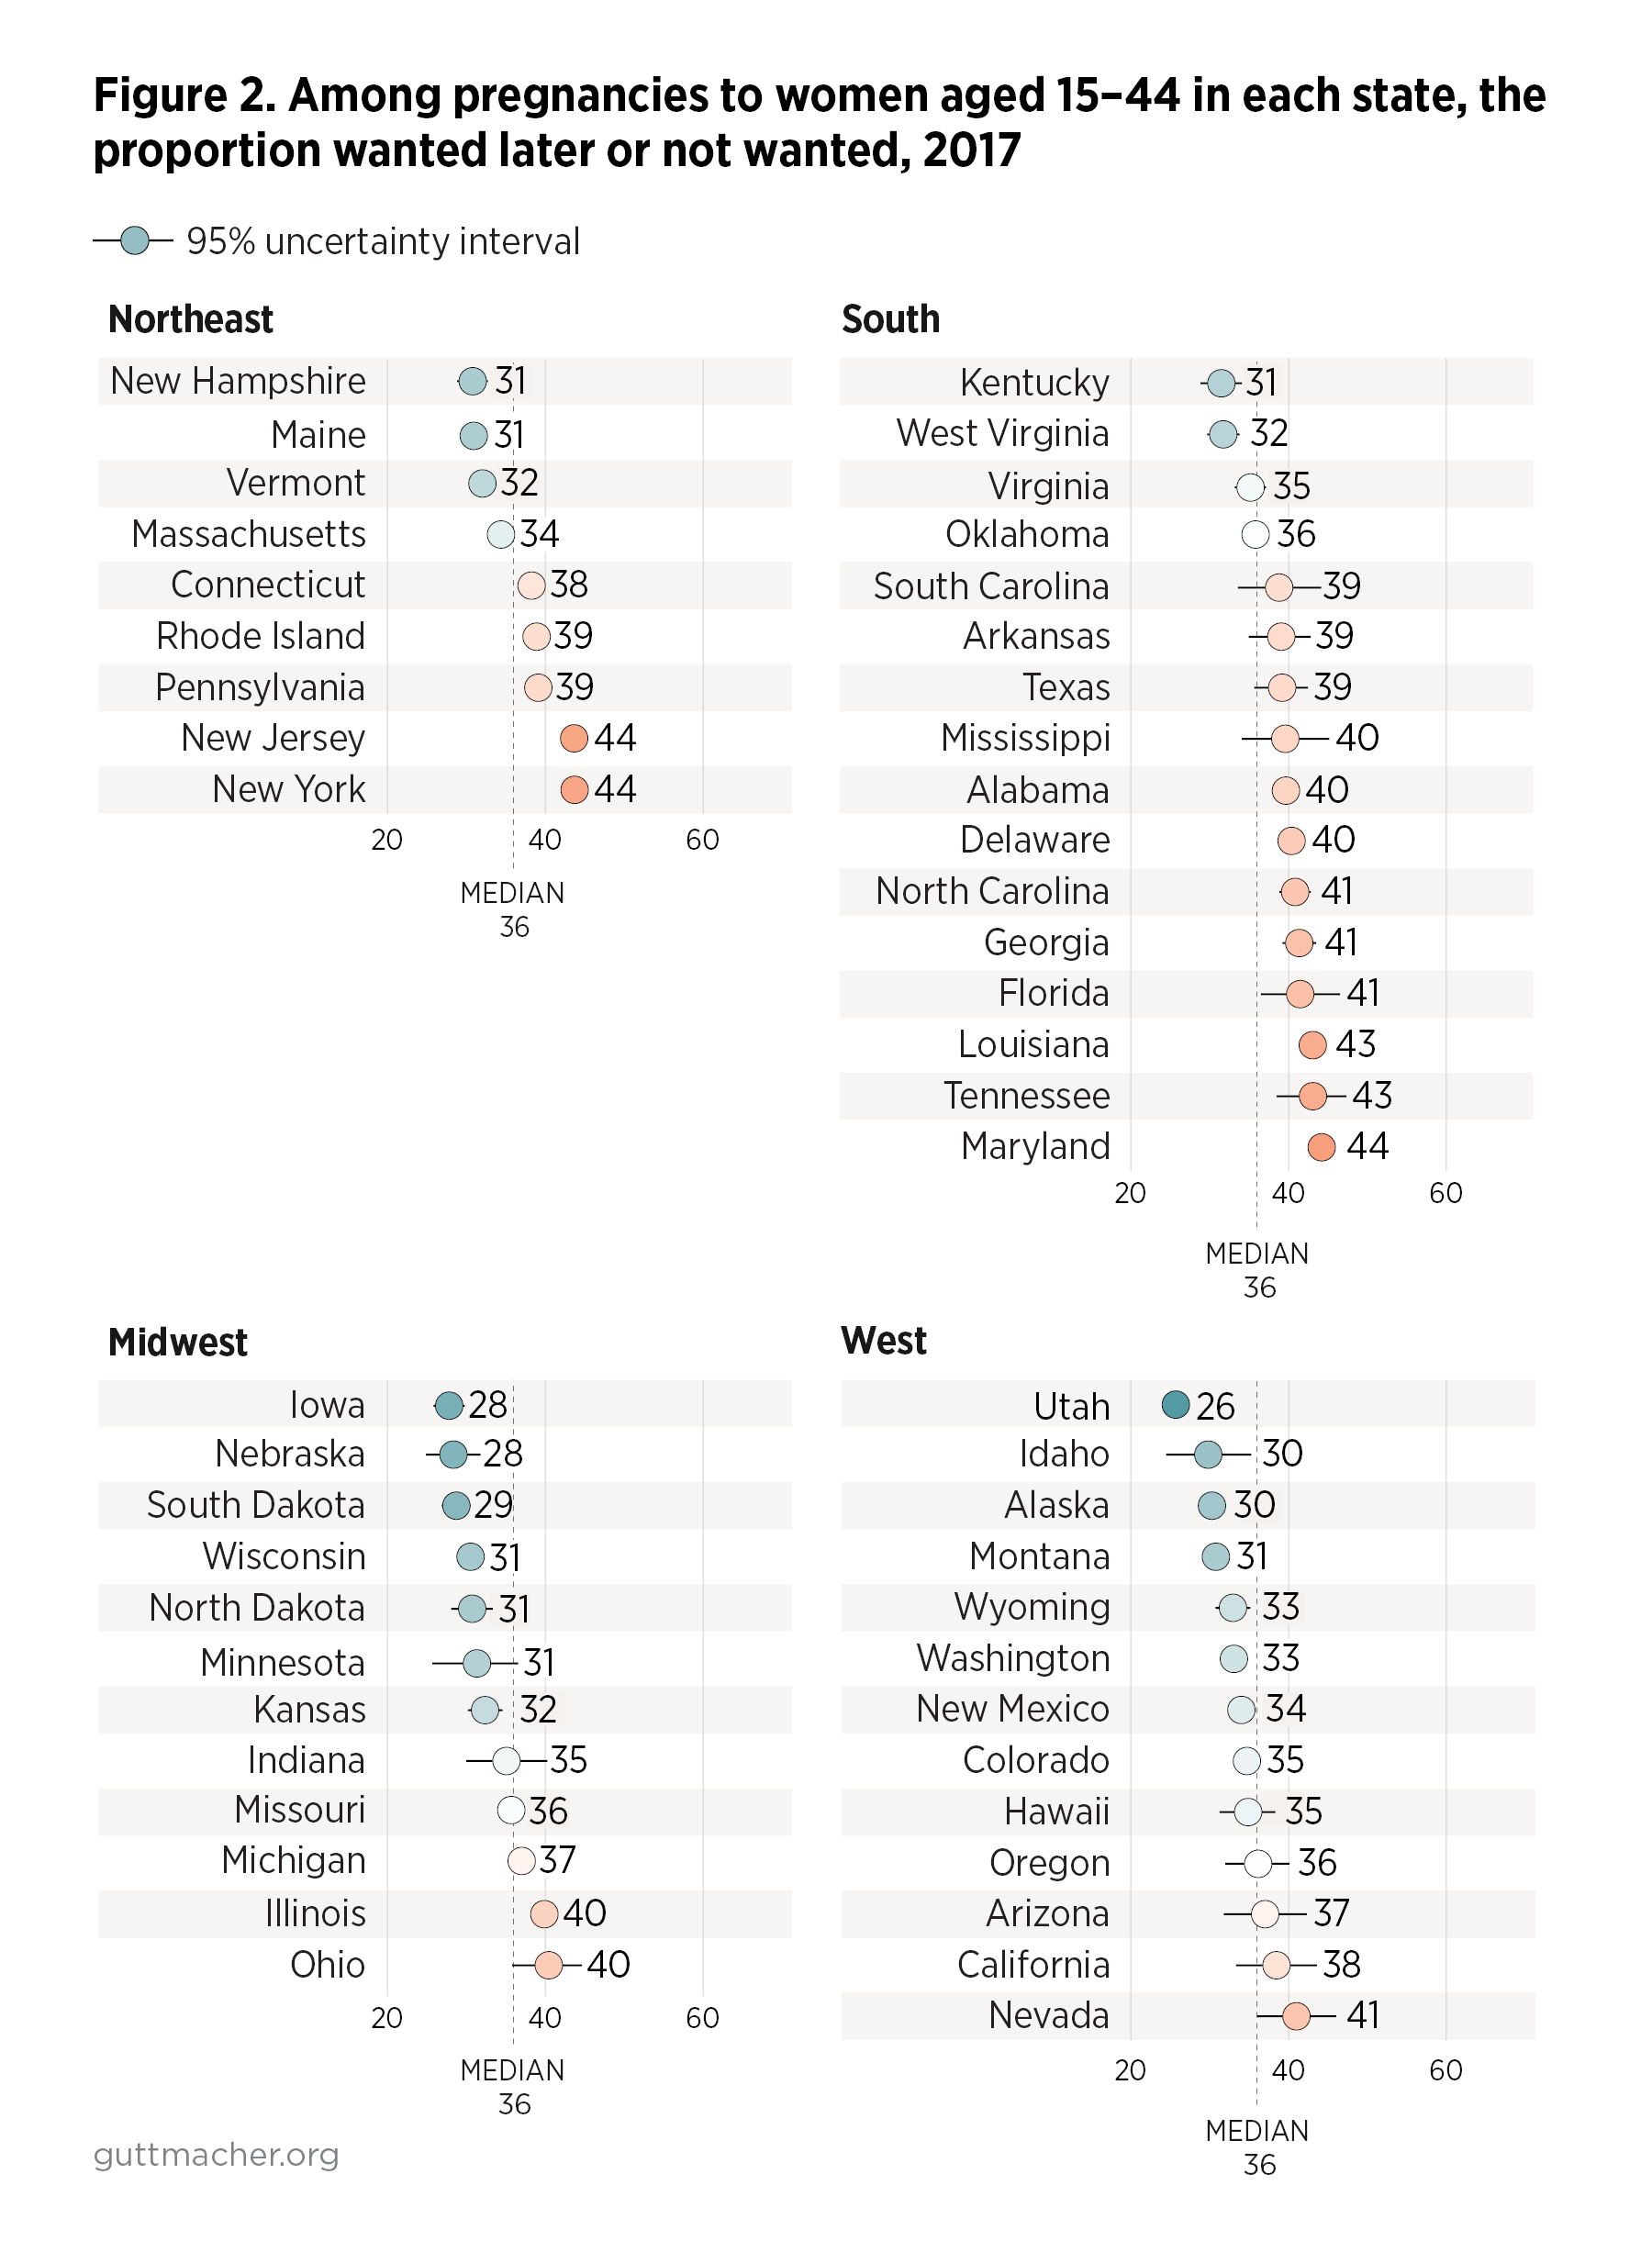
Estimates of the proportion of pregnancies that were wanted later or were unwanted ranged from 26% (24–27%) in Utah to 44% in New Jersey (42–45%), New York (42–45%) and Maryland (43–46%). Similar to the pattern seen among pregnancies that were wanted then or sooner, regional variation was evident for the proportion of pregnancies categorized as wanted later than they occurred or not wanted at all (Figure 2). Higher proportions of such pregnancies were found in the South, the Northeast and states with large urban populations in the West and Midwest.
We also examined the pregnancy outcome among all pregnancies wanted later or not wanted at all in 2017. The proportion of such pregnancies that resulted in a birth ranged from 29% (28–31%) in New Jersey to 69% (68–70%) in South Dakota (Appendix Table 2; PDF download).
Pregnancies characterized by uncertainty
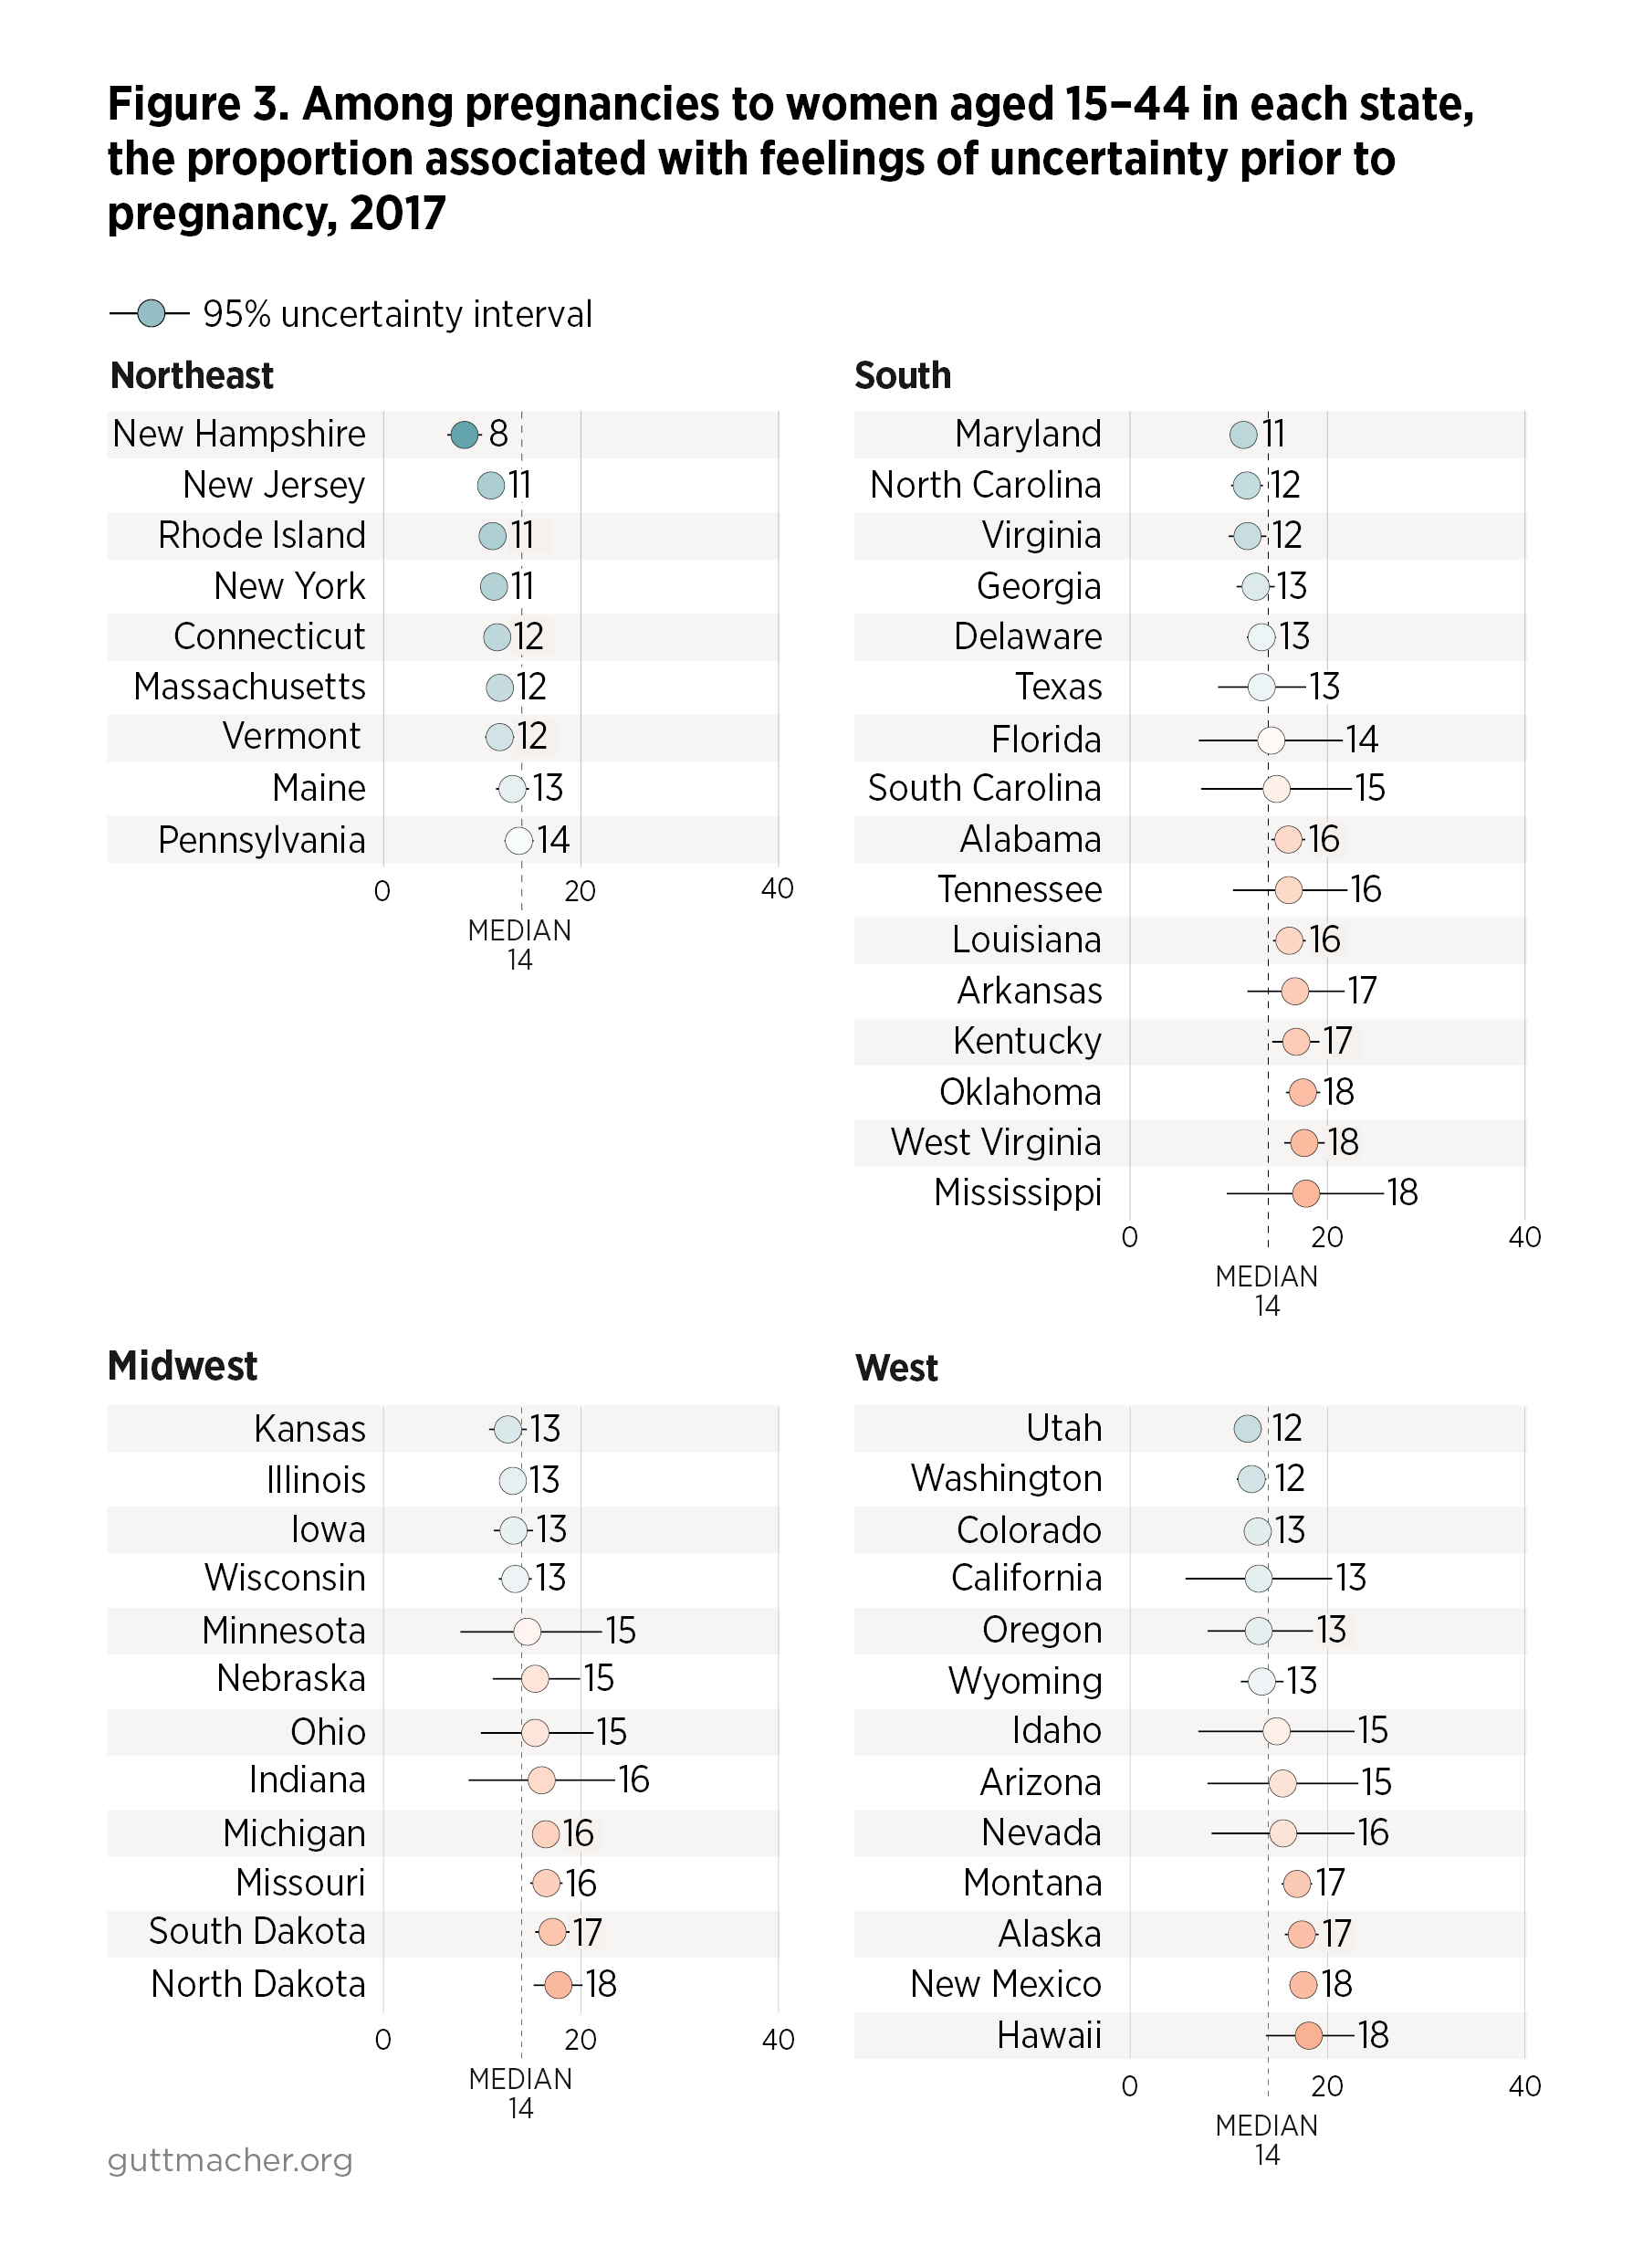
Pregnancies about which women answered "I wasn’t sure what I wanted" ranged from 8% (6–10%) in New Hampshire to 18% in Hawaii (14–23%), North Dakota (15–20%), New Mexico (16–19%), Mississippi (10–26%), Oklahoma (16–19%) and West Virginia (16–20%). The proportion of pregnancies for which individuals said they were not sure what they had wanted was lower in the Northeast than in other regions, which each had substantial variation in this proportion (Figure 3).
Levels and trends in rates of pregnancy according to pregnancy desire, 2012–2017
For each state from 2012 to 2017, we present rates of pregnancies categorized as wanted then or sooner, wanted later or unwanted, or occurring among individuals who expressed uncertainty. Appendix Table 3 (PDF download) lists all rates, calculated as the number of pregnancies per 1,000 women aged 15–44; below, we highlight for each of the three pregnancy desire categories the range of pregnancy rates across the states in 2017 and trends in the rates from 2012 to 2017.
Pregnancies wanted then or sooner
In 2017, wanted-then-or-sooner pregnancy rates ranged from 34 (30–38) pregnancies per 1,000 women aged 15–44 in Tennessee to 57 (55–58) per 1,000 in Utah. There was no consistent pattern of change from 2012 to 2017 across the 42 states with available data. In seven states (Delaware, Maine, Michigan, Missouri, New Hampshire, New Jersey and Rhode Island), wanted-then-or-sooner pregnancy rates rose; in five states (Colorado, Illinois, Oklahoma, Oregon and Utah), they fell; and in 30 states, either rates were stable or uncertainty intervals around the estimates were too wide to confidently show a trend in either direction.
Pregnancies wanted later or not wanted
In 2017, pregnancy rates for pregnancies categorized as wanted later or not wanted ranged from 22 pregnancies per 1,000 women aged 15–44 in New Hampshire (20–23) to 45 (44–46) per 1,000 in New Jersey.
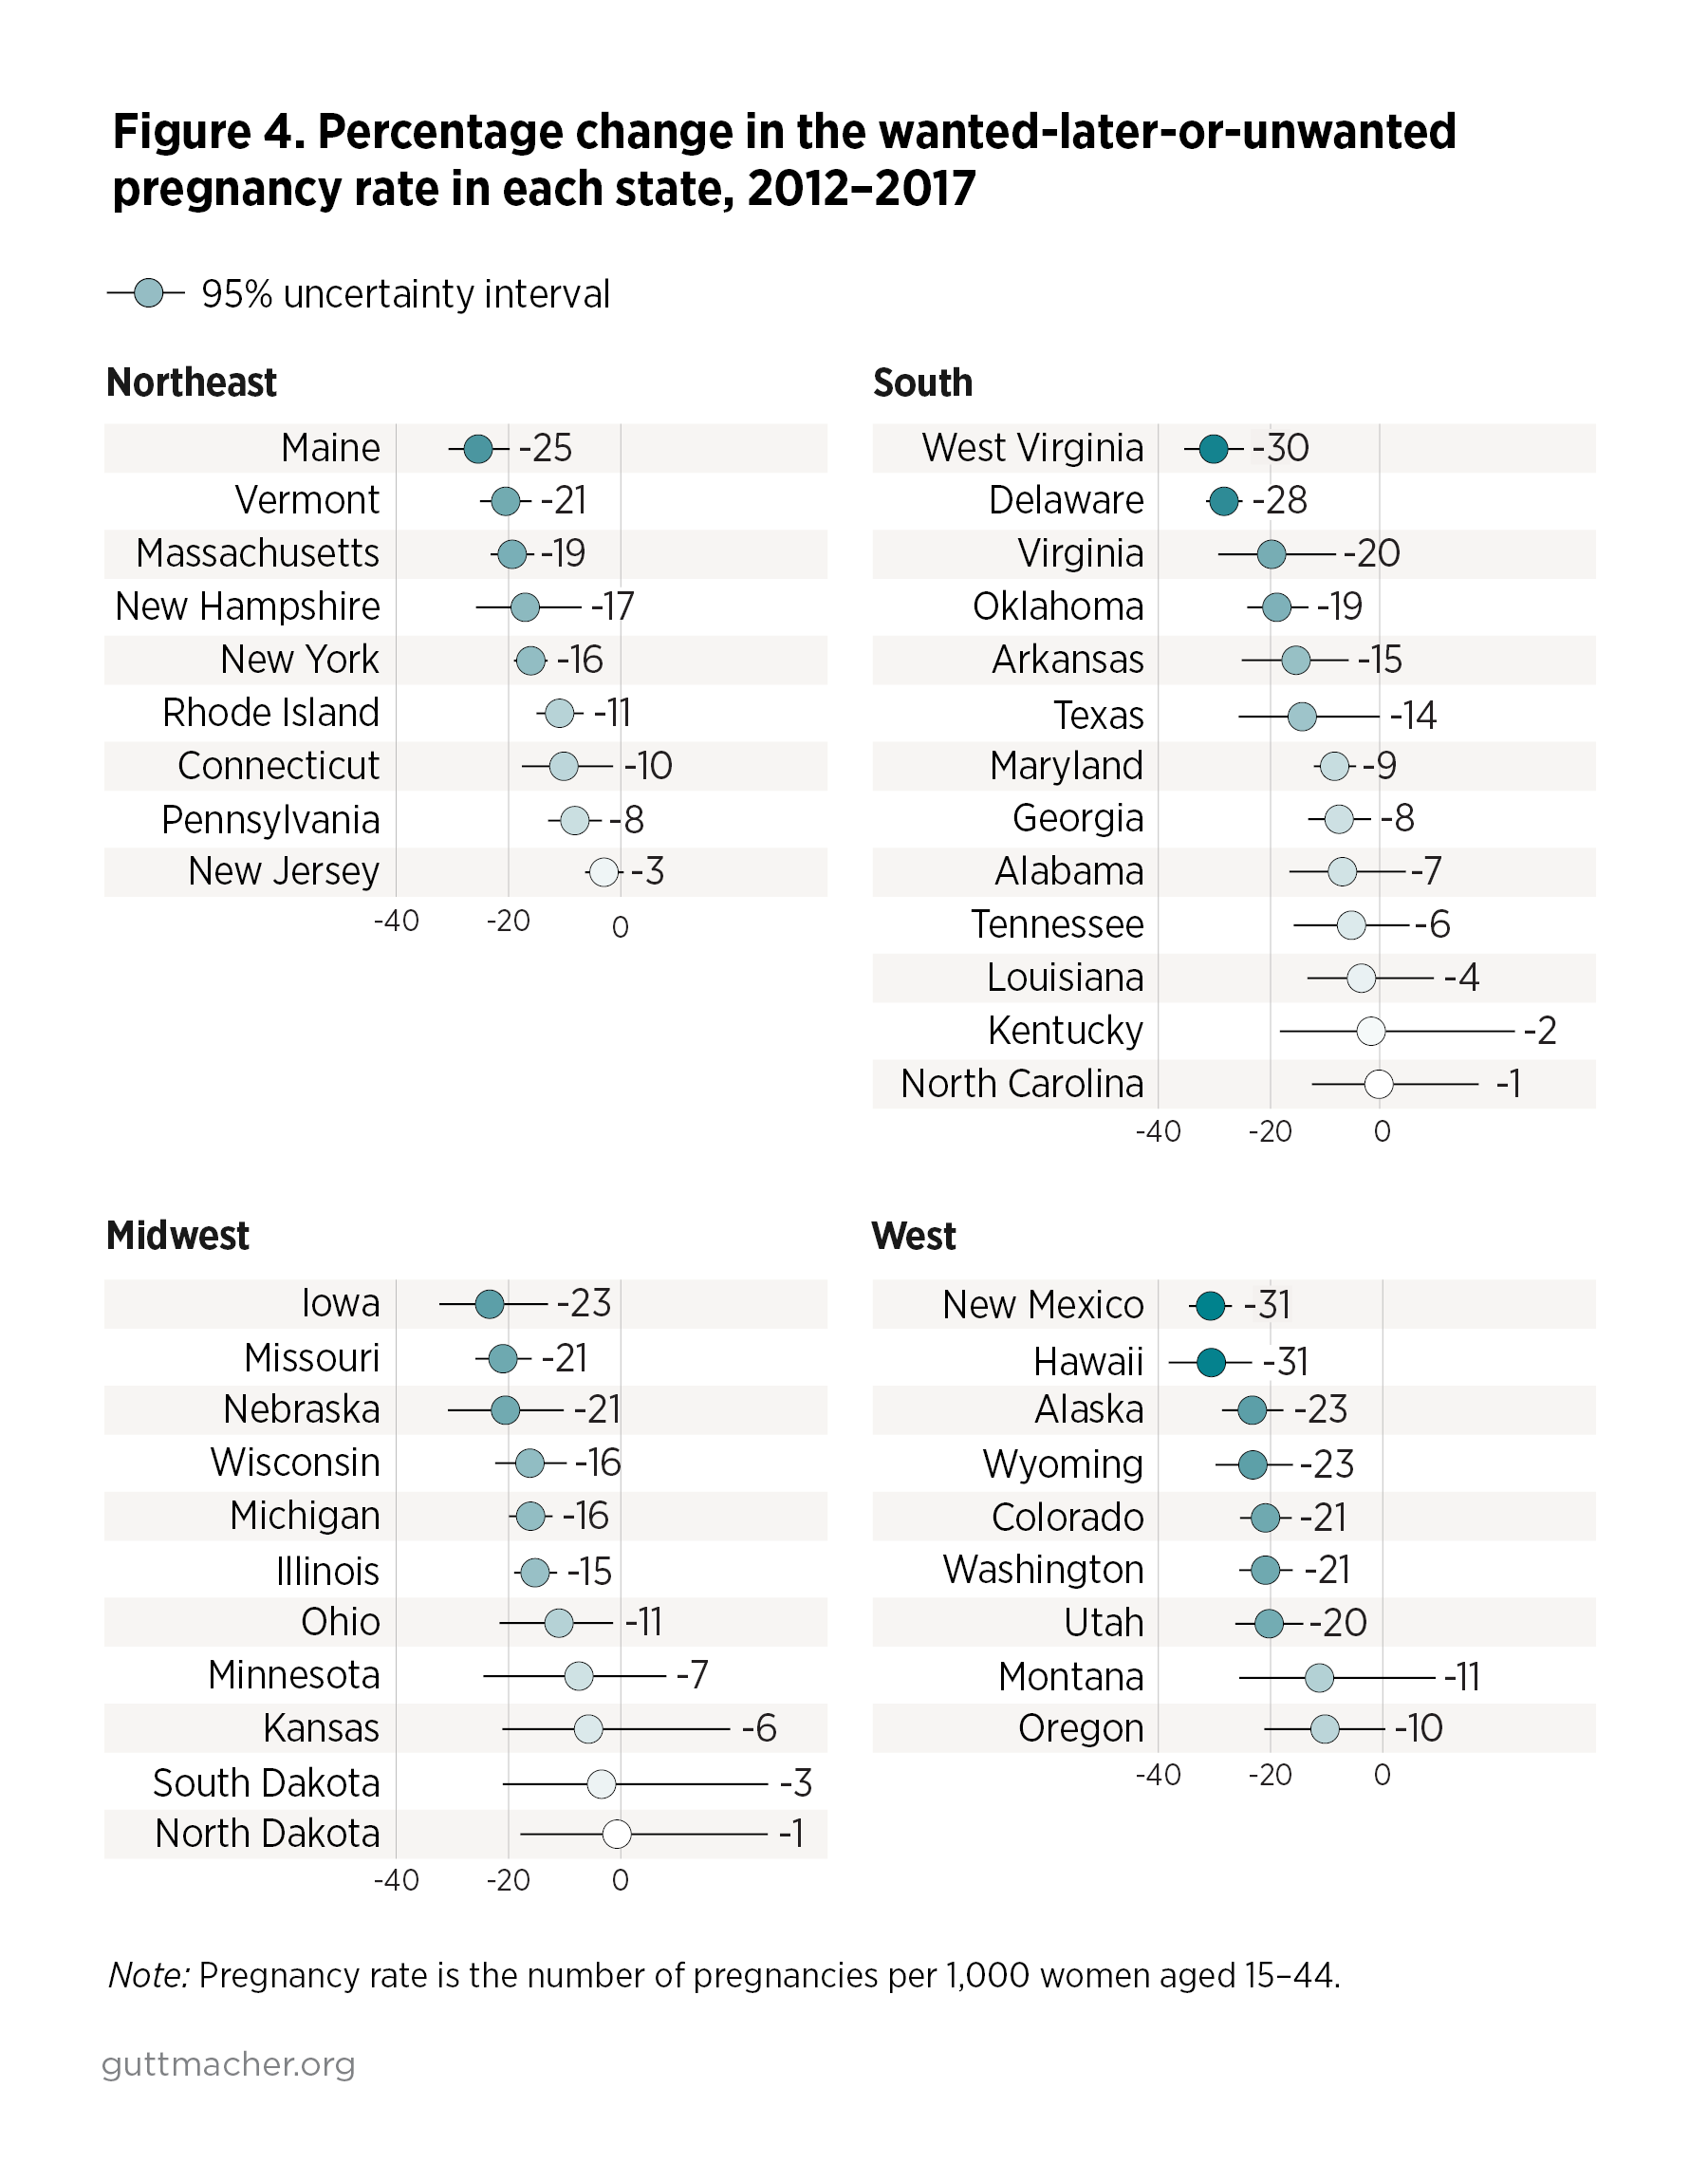
From 2012 to 2017, pregnancy rates for pregnancies wanted later or unwanted fell in the majority of states. There were particularly steep declines in Delaware (–28%, with a 95% uncertainty interval of –25% to –31%), Hawaii (–31%, –23% to –38%), New Mexico (–31%, –27% to –34%) and West Virginia (–30%, –25% to –35%). Among the 42 states with estimated rates for all years, 12 states’ rates were either stable or uncertainty intervals around the estimates were too wide to confidently show a trend in either direction; in no state did the wanted-later-or-unwanted pregnancy rate increase from 2012 to 2017.
The percentage change in the rate of pregnancies categorized as wanted later or not wanted varied geographically from 2012 to 2017 (Figure 4). Declines occurred across the United States, in all regions, with no clear regional pattern.
Pregnancies characterized by uncertainty
The number of pregnancies characterized as occurring when individuals had not been sure that they wanted to become pregnant ranged from 6 (5–7) pregnancies per 1,000 women aged 15–44 in New Hampshire to 17 per 1,000 in Alaska (15–18), Hawaii (13–21) and North Dakota (14–19). There was no clear pattern over time; for almost all states, either rates were stable or uncertainty intervals around the estimates were too wide to confidently show a trend from 2012 to 2017 in either direction.
Distribution of births by reported desires prior to pregnancy, 2017
Though we do not have data to estimate detailed pregnancy desires for pregnancies ending in abortion at the state level, the PRAMS data allow us to examine the distribution of births according to all five categories of pregnancy desire: wanted then, wanted sooner, wanted later, not wanted and wasn’t sure. Appendix Table 4 (PDF download) shows the distribution of births among women according to their reported pregnancy desires for each of the jurisdictions for which we have PRAMS data in 2017. Again, we emphasize that these findings are for births only, not all pregnancies.
In the 35 states and localities with comparable data available, the proportion of births to individuals who reported that they wanted to become pregnant at the time that their pregnancy occurred ranged from 35% (with a 95% confidence interval of 32–39%) in Louisiana to 55% (49–60%) in New Hampshire.
In almost all states and localities, the smallest pregnancy desire group consisted of individuals who reported that, at the time of their pregnancy that led to a birth, they had not wanted to get pregnant then or at any time in the future. This proportion ranged from 4% in Connecticut (3–6%), Iowa (2–6%), New Hampshire (2–6%), New York City (3–6%), New York State excluding New York City (2–6%), Vermont (3–6%) and Washington (3–6%) to 10% in Louisiana (8–12%).
In all states, there were respondents who recalled that they had not been sure about their pregnancy desires prior to the pregnancy that resulted in a birth. The proportion of those who characterized their pregnancy desires this way ranged from 9% in New Hampshire (6–12%) to 20% in Alaska (17–23%) and New Mexico (18–22%).
Summary
Our estimates show that there is considerable variation in desires for pregnancy across the United States. In nearly all states, the largest share of pregnancies in 2017 were reported as occurring at the right time or wanted sooner than they occurred, though states varied widely in these proportions. Geographic variation is evident in the distribution of pregnancies by the three broad pregnancy desire categories we examined: The proportion of pregnancies that were wanted later or unwanted was higher in the South and Northeast, compared with other regions, and the proportion of pregnancies that were wanted at that time or sooner was higher in the West and Midwest.
The most recent research on state-level pregnancy rates has documented declines in most states over the same time period we cover in this report, 2012–2017.3 We found a decrease in the rate of pregnancies categorized as wanted later or not wanted; there was no clear pattern during this period of any decreases in the rate of pregnancies that were reported as occurring at the right time or wanted sooner, or in the rate of those characterized by uncertain pregnancy desire. This suggests that overall declines are largely being driven by declines in pregnancies that were wanted later or not wanted at all.
This report is intentionally descriptive; additional research is needed on the drivers of variation in rates and proportions of pregnancies characterized by different pregnancy desires at the state level. State and local contexts likely have some level of influence on pregnancy desires and on whether individuals are able to successfully achieve those desires. More research in this area could potentially inform policies that would better help individuals both prevent pregnancies when they do not want to become pregnant and achieve pregnancy when they do.
Project summary
The Guttmacher Institute has periodically published estimates of unintended pregnancy rates for individual U.S. states, which has enabled comparisons of experiences across states and insights into state-level influences on health behaviors, outcomes and access that are not evident in a single, national-level measure. As with previous reports that the Institute has published on this topic, in 2011, 2013, 2015 and 2018, this report includes innovations in our methodologies and documents our best estimates of statistics on pregnancies and births at the state level, according to measures of pregnancy desire, using the most recent and available data. Shifts in language across these reports—from "pregnancy intentions" to "pregnancy desire"—also reflect improvements made to better reflect how current surveys measure this important dimension of the pregnancy experience. For these reasons, the estimates in this report are not comparable with those in previously published reports in this body of ongoing work.
Footnote
*Although a small proportion of the pregnancies in this report may have occurred among transgender men or nonbinary people, we are limited to using population counts of women of reproductive age produced by the Census Bureau for the denominators of all rates (see Methodology Appendix).
References
1. Maddow-Zimet I and Kost K, Effect of changes in response options on reported pregnancy intentions: a natural experiment in the United States, Public Health Reports, 2020, 135(3):354–363, https://doi.org/10.1177/0033354920914344.
2. Finer LB and Zolna MR, Declines in unintended pregnancy in the United States, 2008–2011, New England Journal of Medicine, 2016, 374(9):843–852, https://www.nejm.org/doi/10.1056/NEJMsa1506575.
3. Maddow-Zimet I and Kost K, Pregnancies, Births and Abortions in the United States, 1973–2017: National and State Trends by Age, New York: Guttmacher Institute, 2021, https://doi.org/10.1363/2021.32709.
